Figure 8. Absence of backlabeled retinal
ganglion cells due to axonal transport impairment and cell loss. A-H:
These representative examples show whole-mounts of a control retina (A-D)
labeled with 10% hydroxystilbamidine methanesulfonate (OHSt) (A)
and its isodensity map (C), as well as the same retina
immunolabeled with Brn3a (B) to identify surviving RGCs and the
corresponding isodensity map (D). To identify RGCs capable of
retrograde axonal transport, OHSt was applied to both superior
colliculi 1 week before sacrifice. To identify surviving RGCs, retinas
were processed for Brn3a immunohistochemistry. Note the presence of
intensely stained RGCs distributed throughout the entire control
retina, with a typical high-density region along a naso-temporal streak
in the superior retina, which is clearly shown in the isodensity maps
of OHSt-labeled RGCs (C) and Brn3a-labeled RGCs (D). E-H:
Representative examples of experimental retinas at 8 (E, F)
and 35 (G, H) days after lasering, showing the isodensity maps
of OHSt-labeled RGCs (E, G) and Brn3a-labeled RGCs (F,
H). Both experimental retinas show fewer OHSt- and Brn3a-labeled
RGCs than in the control retinas. Moreover, the population of
Brn3a-labeled RGCs was greater than that of OHSt-labeled RGCs at 8 but
not at 35 days, indicating compromised retrograde axonal transport
within the first week after lasering and demonstrating that the lack of
retrograde labeling in the retina is due not only to RGC degeneration
but also to an impairment of the axoplasmic flow. The diminution in the
numbers of Brn3a+RGCs observed between the control retina
and retinas analyzed 8 and 35 days after lasering also documents the
loss of RGCs. Isodensity maps were generated by assigning a color code
to each of the subdivisions of each individual frame according to its
RGC density value within a 45-step color scale range, from 0 (dark
blue) to 5,625 RGCs/mm2 or higher (red). For all retinas,
the dorsal pole is orientated at 12 o’clock (scale bar=1 mm).
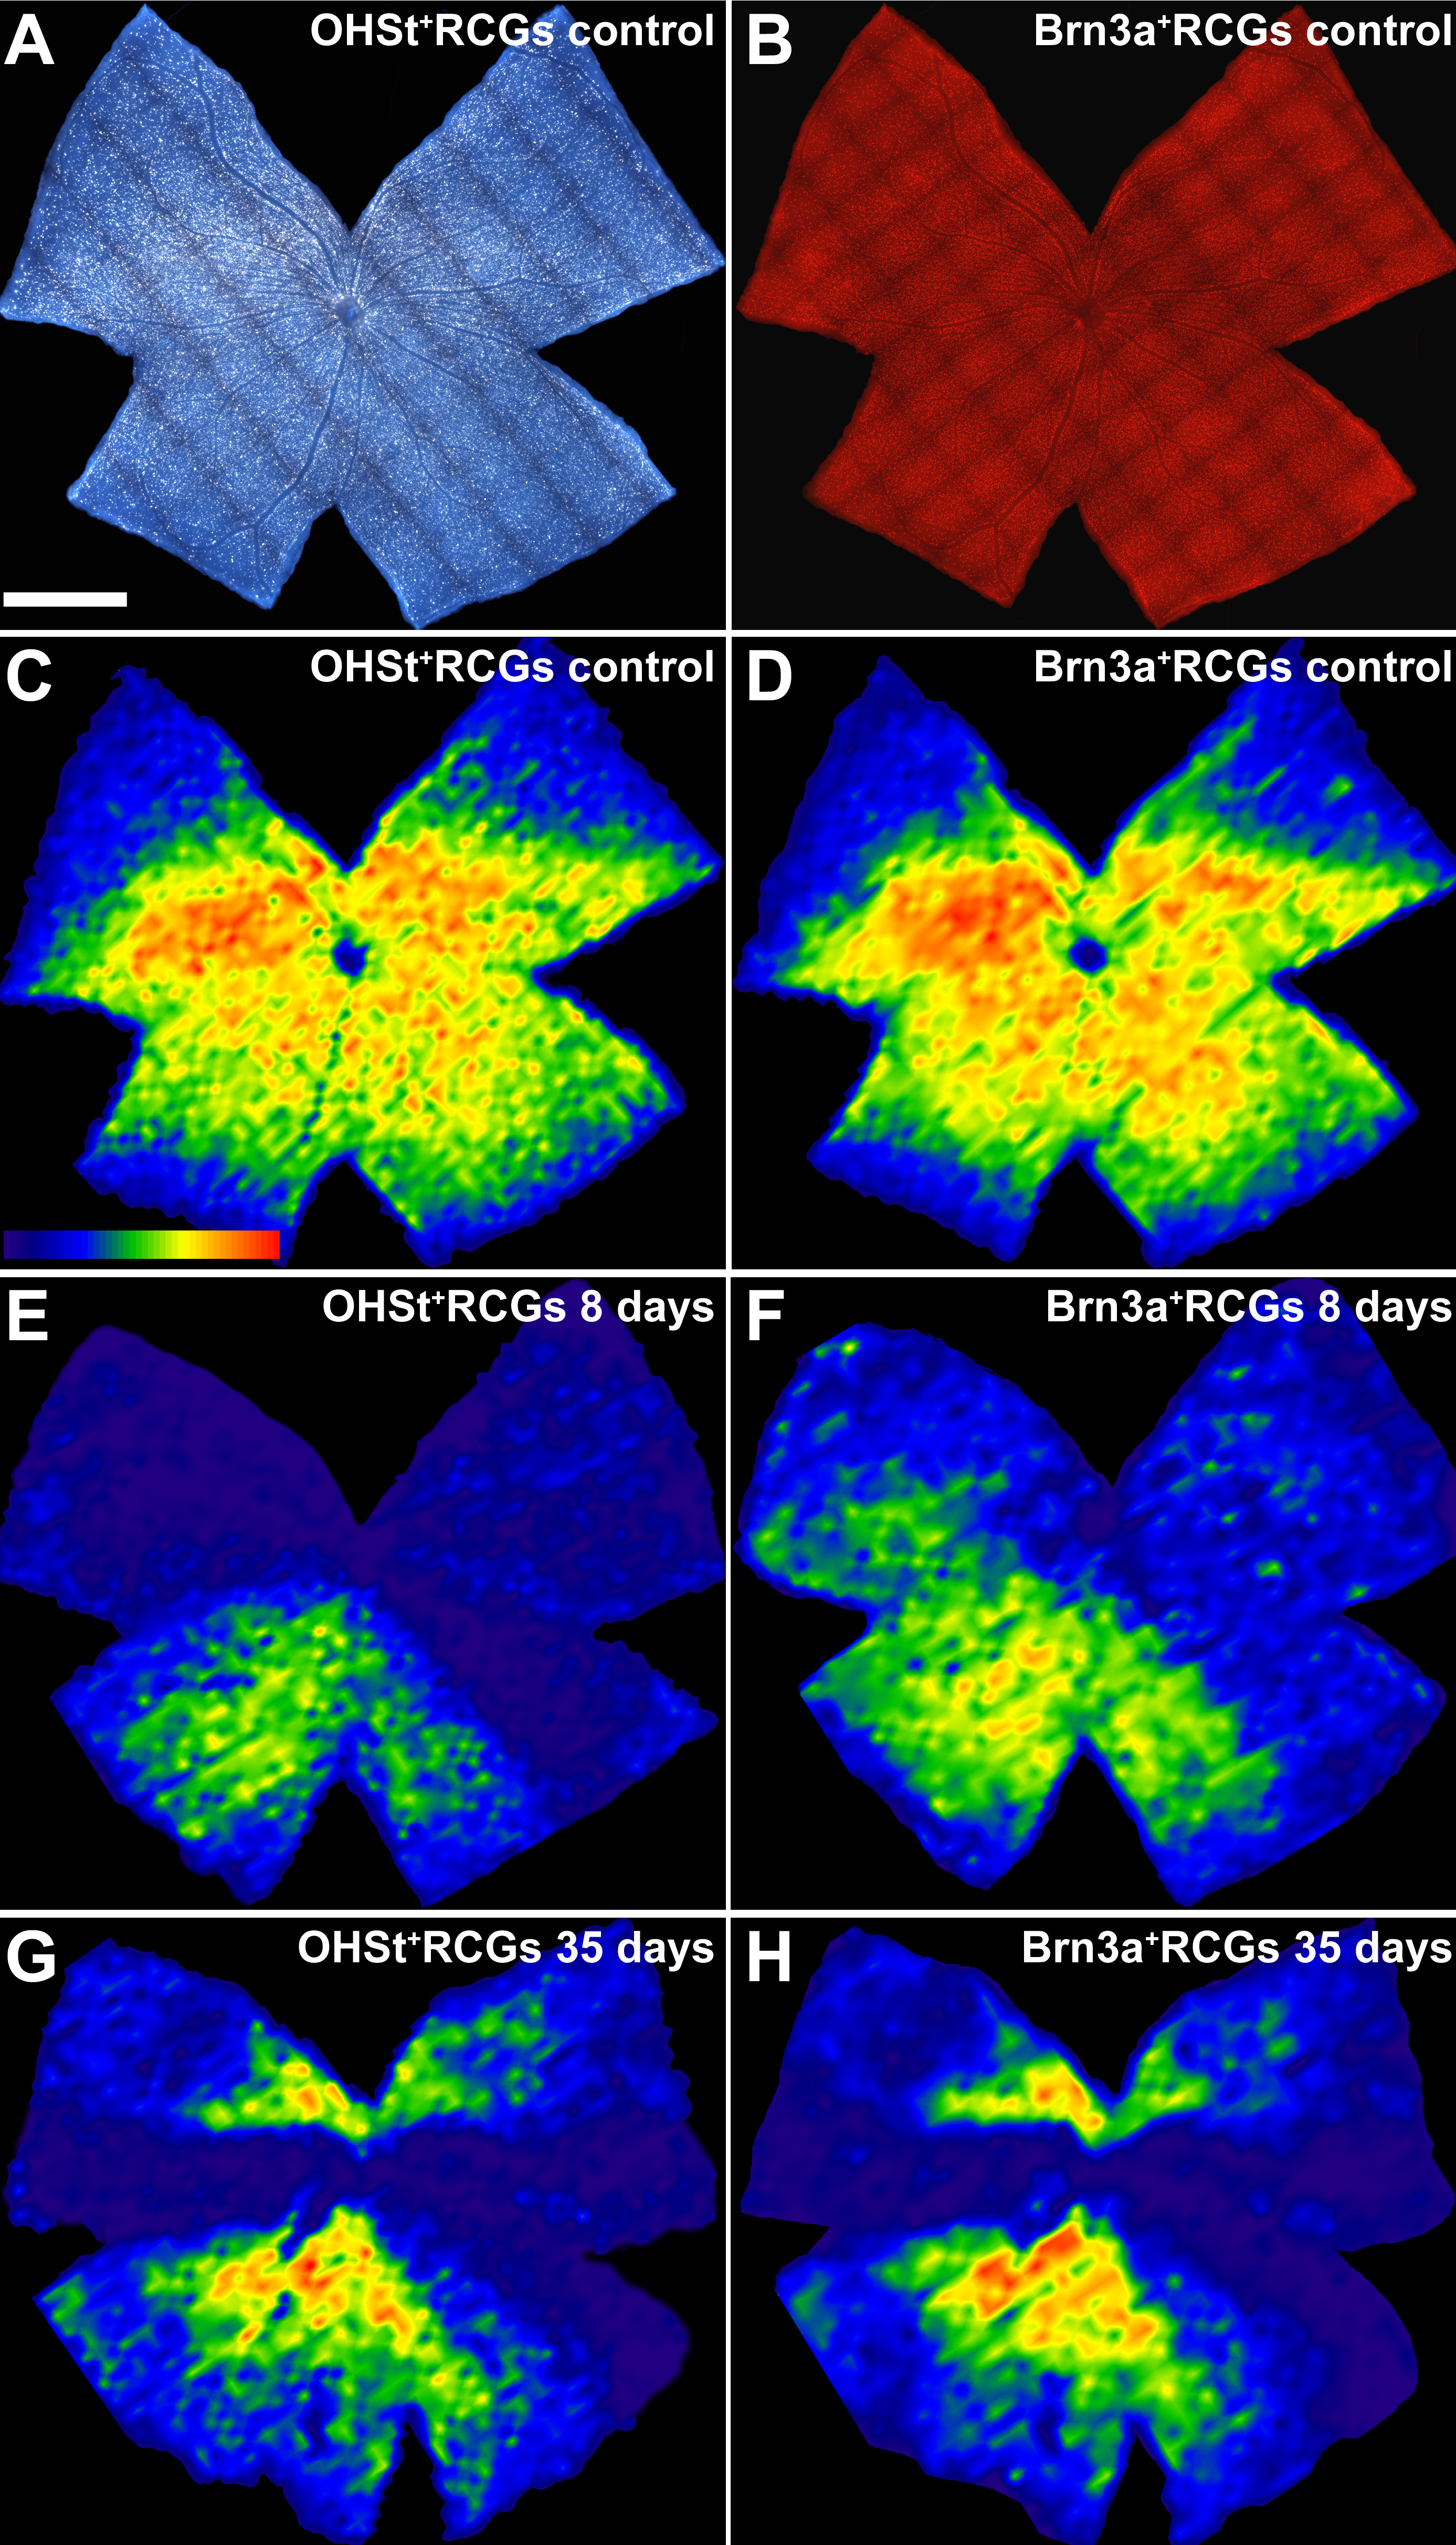
 Figure 8 of Salinas-Navarro, Mol Vis 2009; 15:2578-2598.