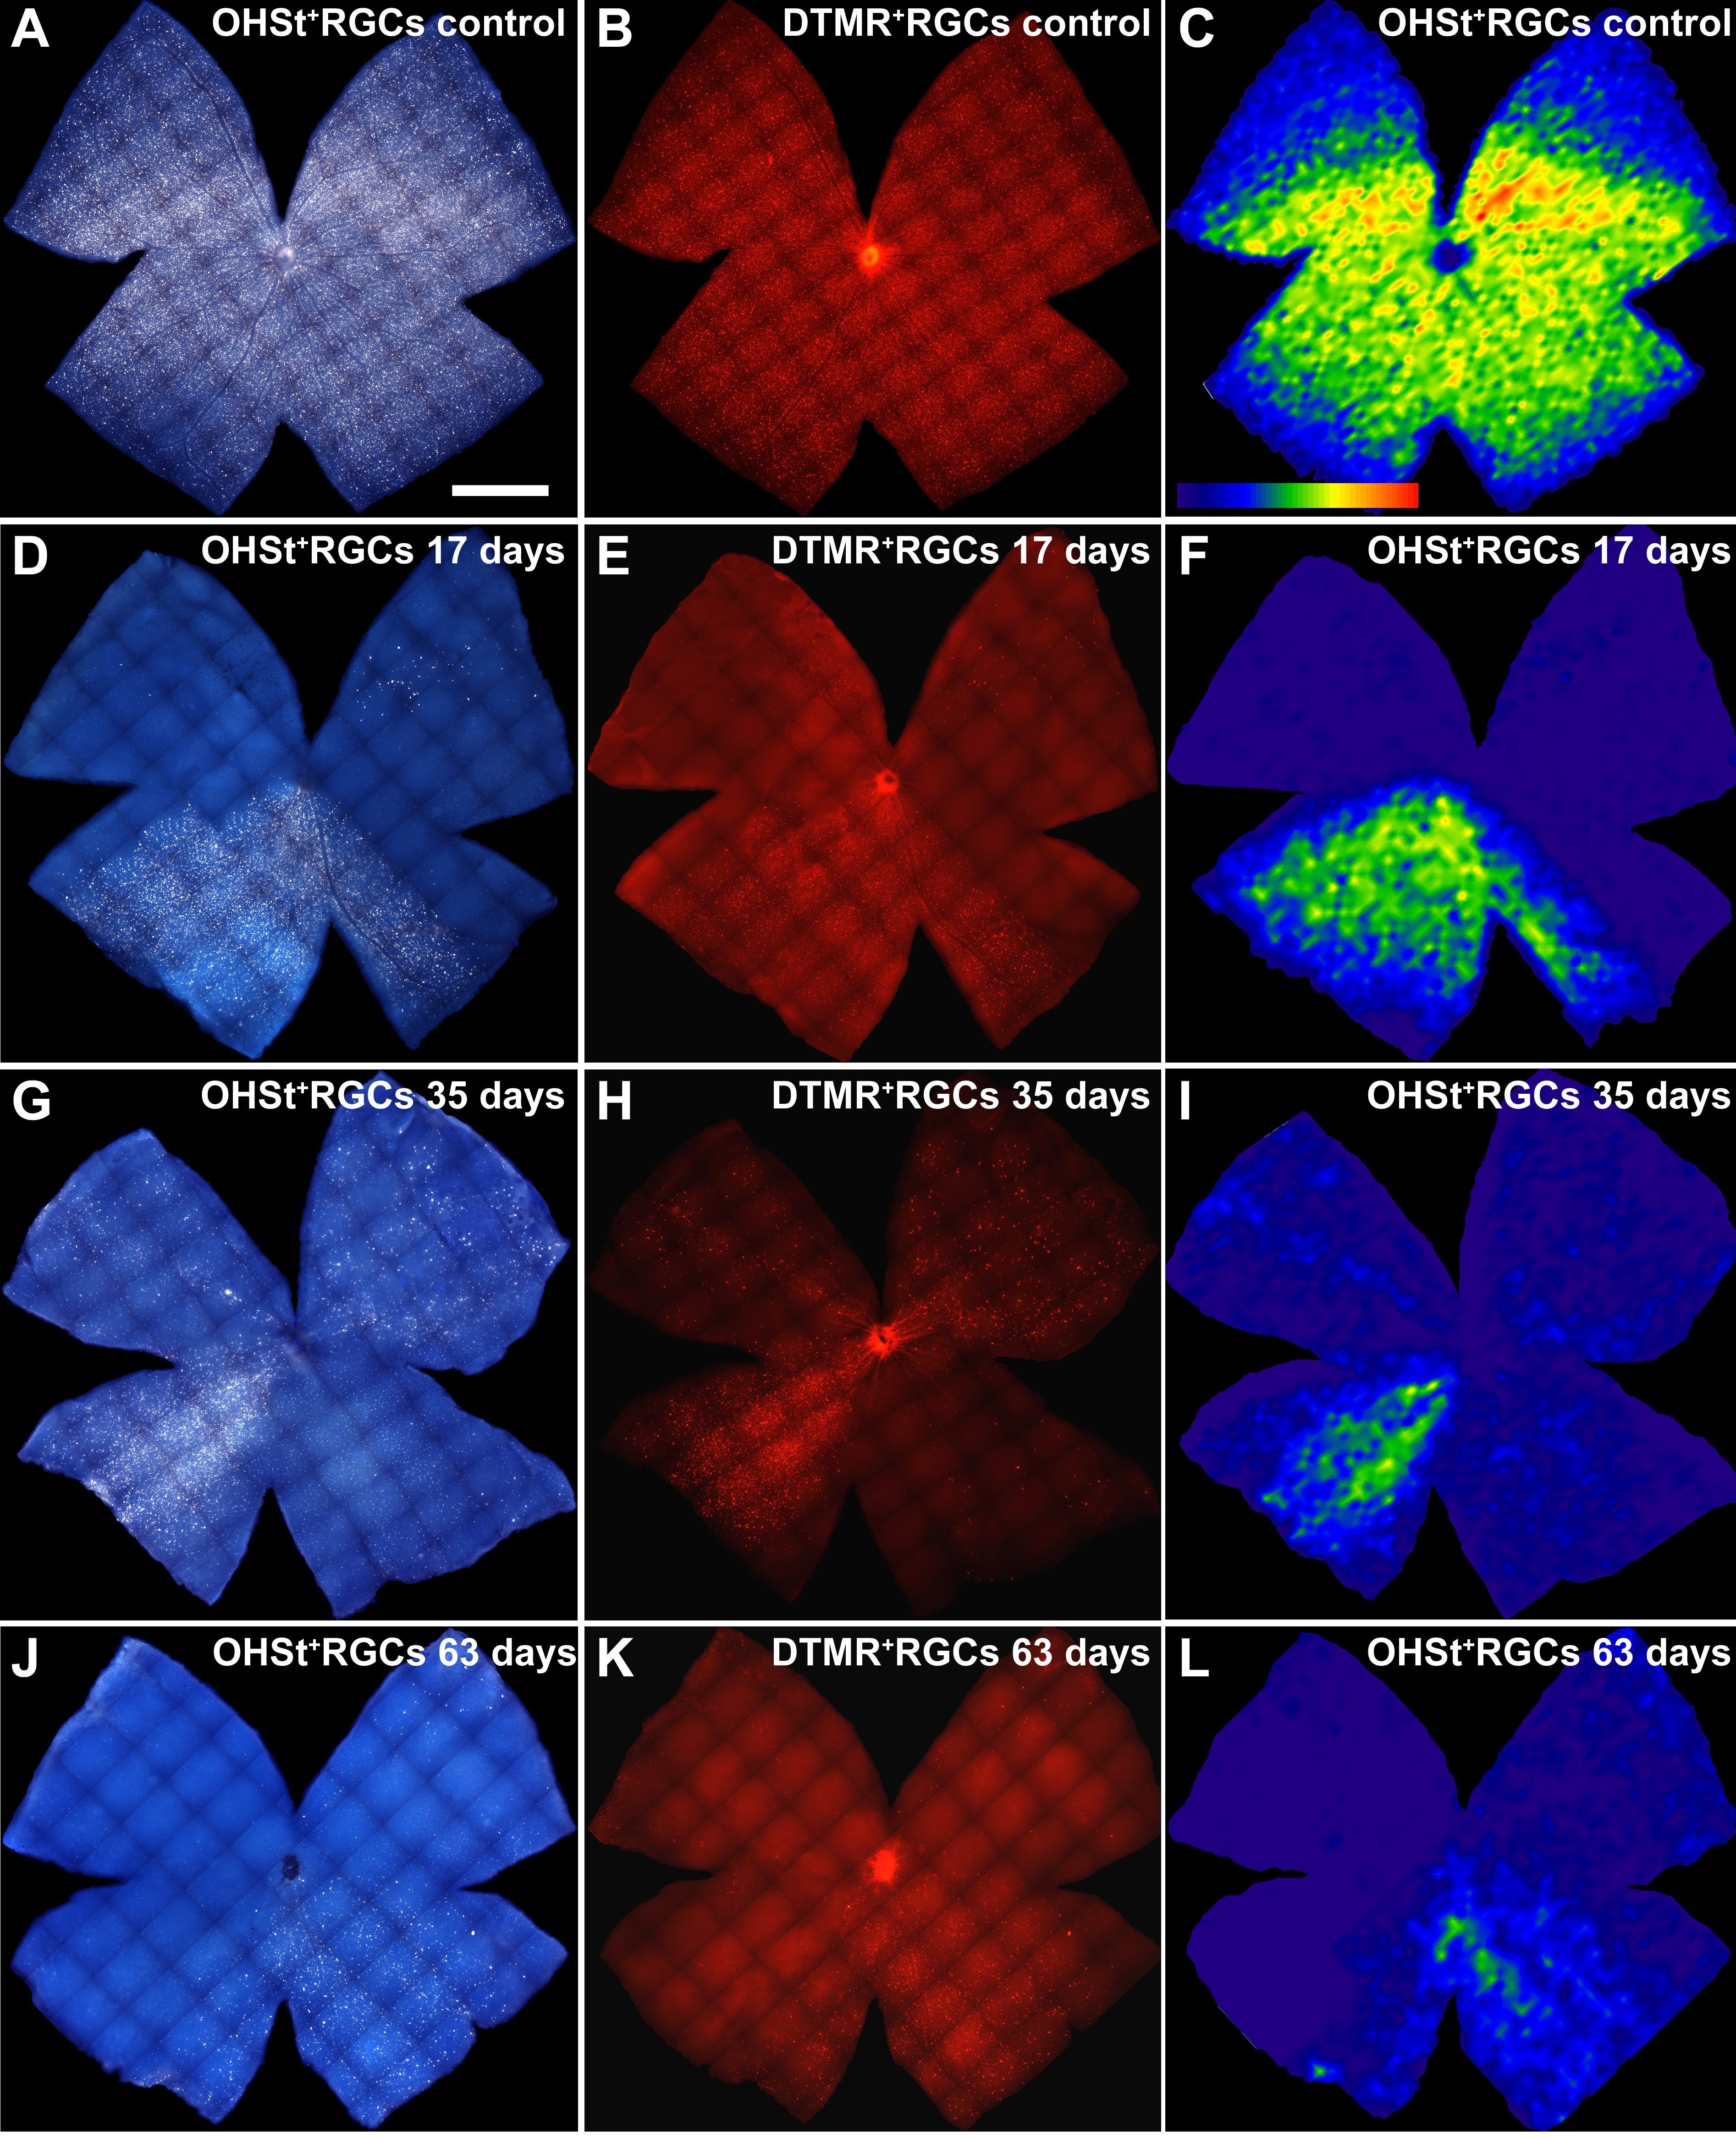
Figure 7. Isodensity maps of retinal
ganglion cells labeled with dextran tetramethylrhodamine and 10%
hydroxystilbamidine methanesulfonate in control and experimental
retinas. Retinal whole-mounts of representative adult albino Swiss mice
are shown at different survival intervals after lasering the left eye
and treating with dextran tetramethylrhodamine (DTMR) and 10%
hydroxystilbamidine methanesulfonate (OHSt). To identify retinal
ganglion cells (RGCs) capable of retrograde axonal transport, OHSt was
applied to both superior colliculi 1 week before animal sacrifice, and
to identify RGCs with a competent axon at the level of the optic nerve
(ON) head, DTMR was applied to the ocular stump of the intraorbitally
divided ON 2 days before sacrifice. These retinal whole-mounts
illustrate typical topological distributions of OHSt
+ RGCs
and DTMR
+ RGCs throughout these retinas. Note the close
correspondence of the areas lacking backlabeled RGCs with both tracers
for each illustrated retina. For all retinas, the dorsal pole is
orientated at the 12 o’clock position (scale bar=1 mm).
A-
C:
Whole-mount of a representative control right retina double-labeled
with OHSt (
A) applied 1 week before dissection and DTMR (
B)
applied 5 days later. An isodensity map of OHSt-labeled RGCs was
constructed by splitting each frame into 36 parts and estimating RGC
densities (
C). Intensely labeled RGCs are distributed throughout
the retina, but higher densities are present in a region along the
naso-temporal axis of the superior retina, resembling a visual streak [
69].
D-
F:
Whole-mounts of a representative experimental left retina from Group II
(17 days after lasering) show the lack of OHSt-labeled RGCs (
D)
in a large sector that comprises the superior and small sectors of the
inferior retina. Stained with DTMR (
E), the same retinal sector
shows few to no DTMR-labeled RGCs. An OHSt-labeled RGC isodensity map (
F)
illustrates the areas lacking backlabeled RGCs in a sector that spans
almost from the 4 o’clock position to half past 8 o’clock.
G-
I:
These whole-mounts of representative experimental retinas from Group
III (35 days after lasering) show important diminutions in the numbers
of OHSt-labeled RGCs (
G) in all quadrants of the retina, except
for the inferior-nasal. When stained with DTMR (
H), the same
retinal quadrants show few to no DTMR-labeled RGCs. The OHSt-labeled
RGC isodensity map (
I) illustrates the areas that lack
backlabeled RGCs.
J-
L: Whole-mounts of a representative
experimental retina from Group IV (63 days after lasering) show a lack
of OHSt-labeled RGCs (
J) mainly within the nasal retina and the
superior-temporal quadrant. Stained with DTMR (
K), the same
retinal quadrants showed few to no DTMR-labeled RGCs. The OHSt-labeled
RGC isodensity map (
L) also illustrates the areas with focal
loss of RGCs, as well as a small sector of the inferior temporal
quadrant that shows diffuse loss of backlabeled RGCs.
 Figure 7 of Salinas-Navarro, Mol Vis 2009; 15:2578-2598.