Figure 6. Isodensity maps of retinal
ganglion cells labeled with 10% hydroxystilbamidine methanesulfonate in
experimental retinas. The isodensity maps of representative
experimental retinas from groups I (A-C), II (D-F),
III (G-I), and IV (J-L) illustrate regions
with different densities of retinal ganglion cells labeled with 10%
hydroxystilbamidine methanesulfonate (OHSt+ RGCs). To
identify RGCs capable of retrograde axonal transport, OHSt was applied
to both superior colliculi one week before animal processing.
Whole-mount reconstructions were prepared with the aid of a motorized
stage on a photomicroscope with a high-resolution camera connected to
an image analysis system (Image-Pro Plus, V5; Media Cybernetics, Silver
Spring, MD). Retinal multi frame acquisitions were photographed in a
raster scan pattern in which contiguous frames were captured with no
gap or overlap. Isodensity maps were generated by assigning a color
code to each of the 36 subdivisions of each individual frame according
to its RGC density value within a 45-step color scale range, from 0
(dark blue) to 5,625 RGCs/mm2 or higher (red). For all
retinas, the dorsal pole is orientated at 12 o’clock (scale bar=1 mm).
Note that there are many regions with focal loss— that is, with almost
no backlabeled RGCs — as well as regions with sparsely distributed
RGCs. For example, the retina illustrated in E shows a region
containing backlabeled RGCs restricted to a wedge between the 5 and 10
o’clock positions. The retina illustrated in A also shows backlabeled
RGCs in higher numbers within a large wedge between 5 and 10 o’clock,
but spared RGCs are also distributed throughout the rest of the retina
in lighter densities, as reflected by the cooler than normal colors. In
the four groups, approximately 91% of the retinas show areas with
severe absence of RGCs. This absence is primarily (in 94% of the
retinas) in the dorsal retina.
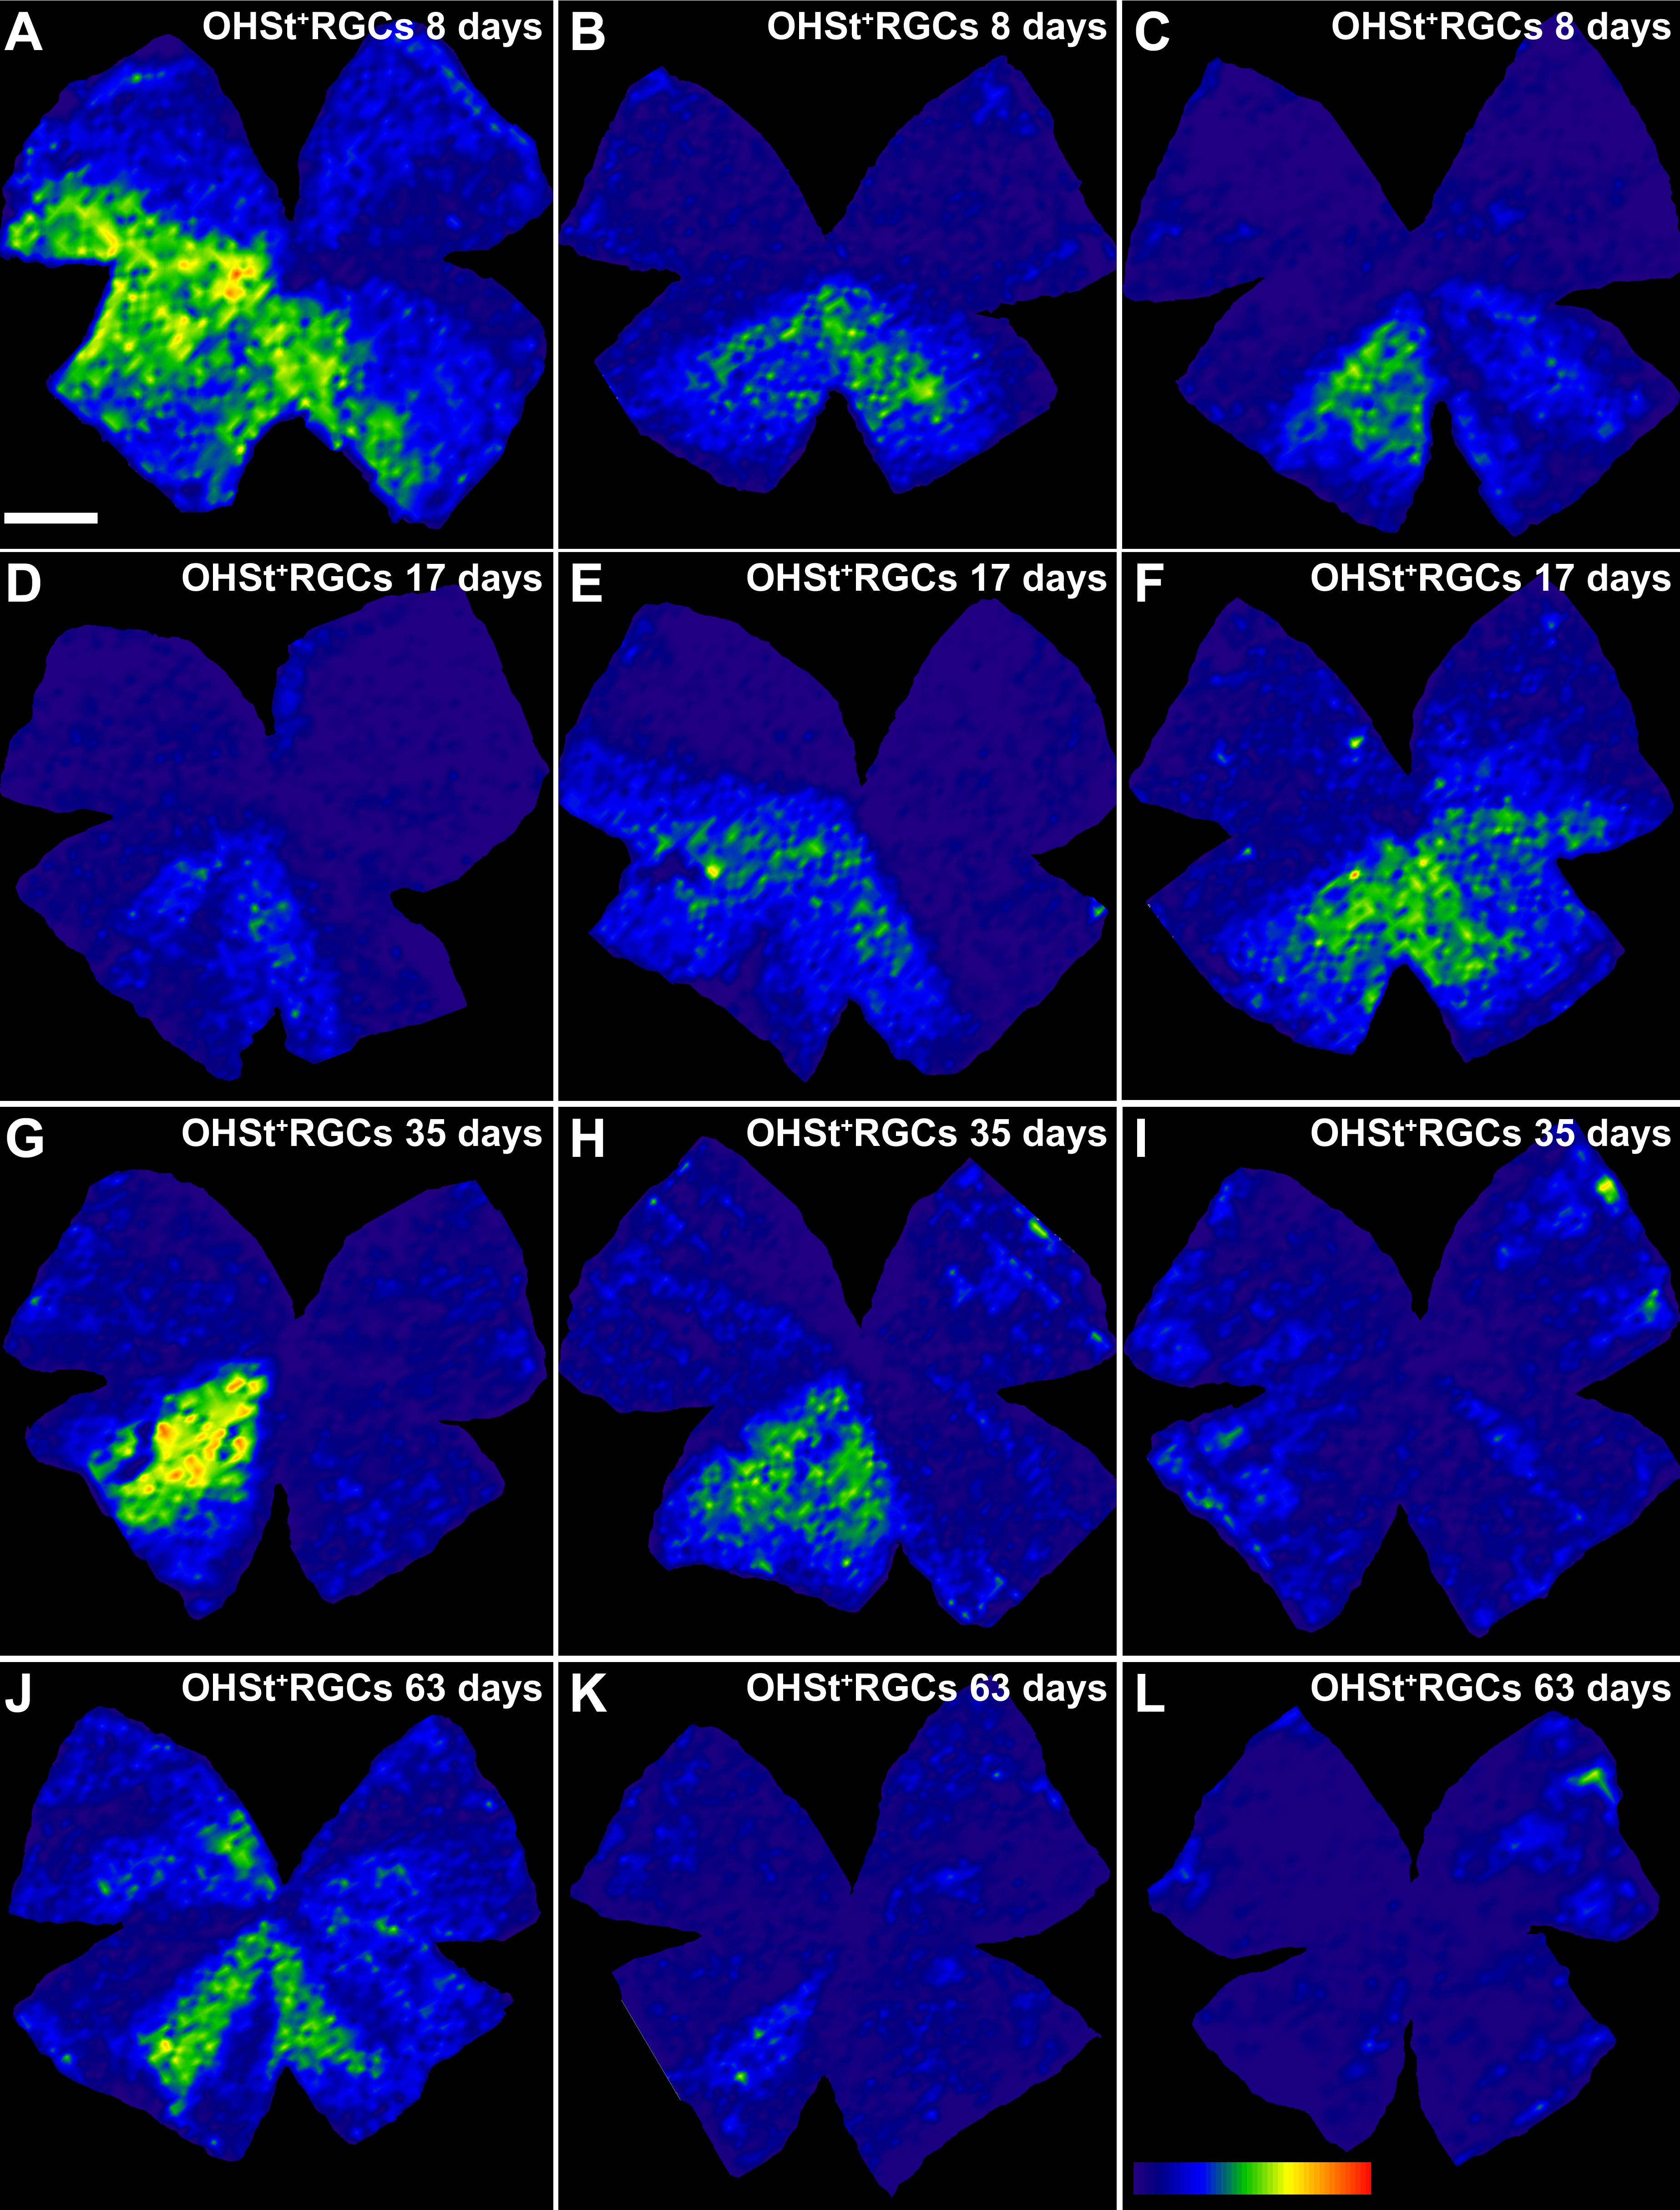
 Figure 6 of Salinas-Navarro, Mol Vis 2009; 15:2578-2598.