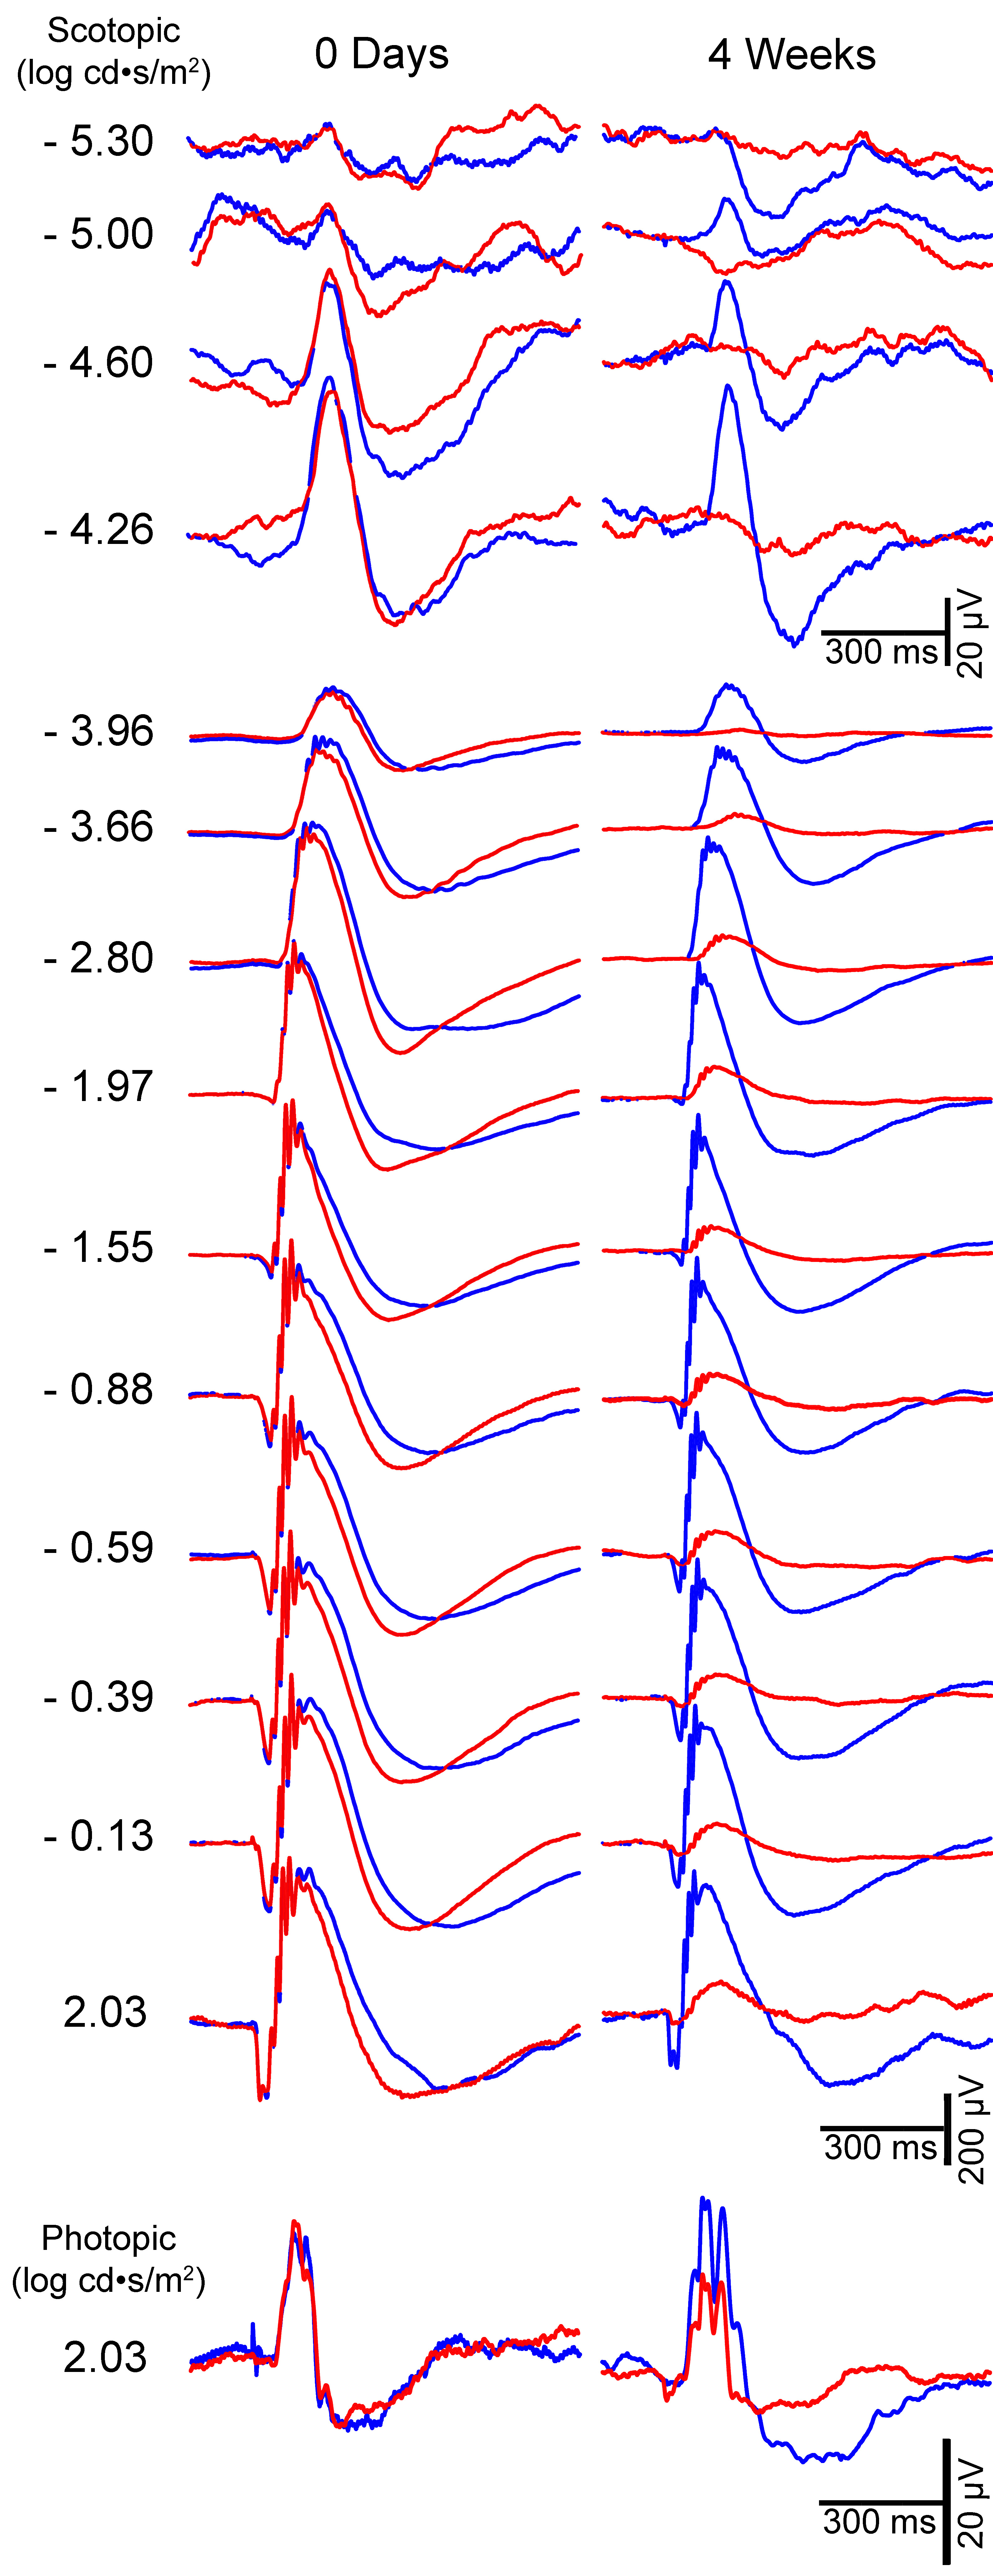
Figure 2. Examples of ERG traces recorded
before and four weeks after laser photocoagulation in one
representative animal. Electroretinogram recordings in response to
flash stimuli of increasing intensity for the untreated right eye (blue
traces) and for the lasered left eye (red traces) from one animal in
group III. The intensity of the flash stimulus is indicated to the left
of each of the recording traces. No difference was observed between the
electroretinogram amplitudes of the left and right eyes before laser
treatment (0 days), while a significant reduction in all components is
clearly visible in the treated eye at four weeks post-treatment (4
weeks), both in scotopic and photopic light conditions.

 Figure 2 of Salinas-Navarro, Mol Vis 2009; 15:2578-2598.
  Figure 2 of Salinas-Navarro, Mol Vis 2009; 15:2578-2598.