Figure 1. Measurements of intraocular
pressure. A-D: Histograms show mean (±SD) intraocular
pressures (IOP) for the right eye (RE) and left eye (LE) in groups I (A),
II (B), III (C), and IV (D) of mice sacrificed 8,
17, 35, and 63 days, respectively, after laser photocoagulation of the
limbal and episcleral veins of the LE. Each received an average of 72
laser-burning spots in a single session. IOP values in group I (A)
rose and peaked by day 1 post-treatment, were maintained until day 5,
and then gradually returned to basal preoperative levels by the end of
a week. IOP values in groups II (B), III (C), and IV (D)
followed a similar pattern of pressure variations, indicating that
elevated IOP was not maintained beyond 1 week.
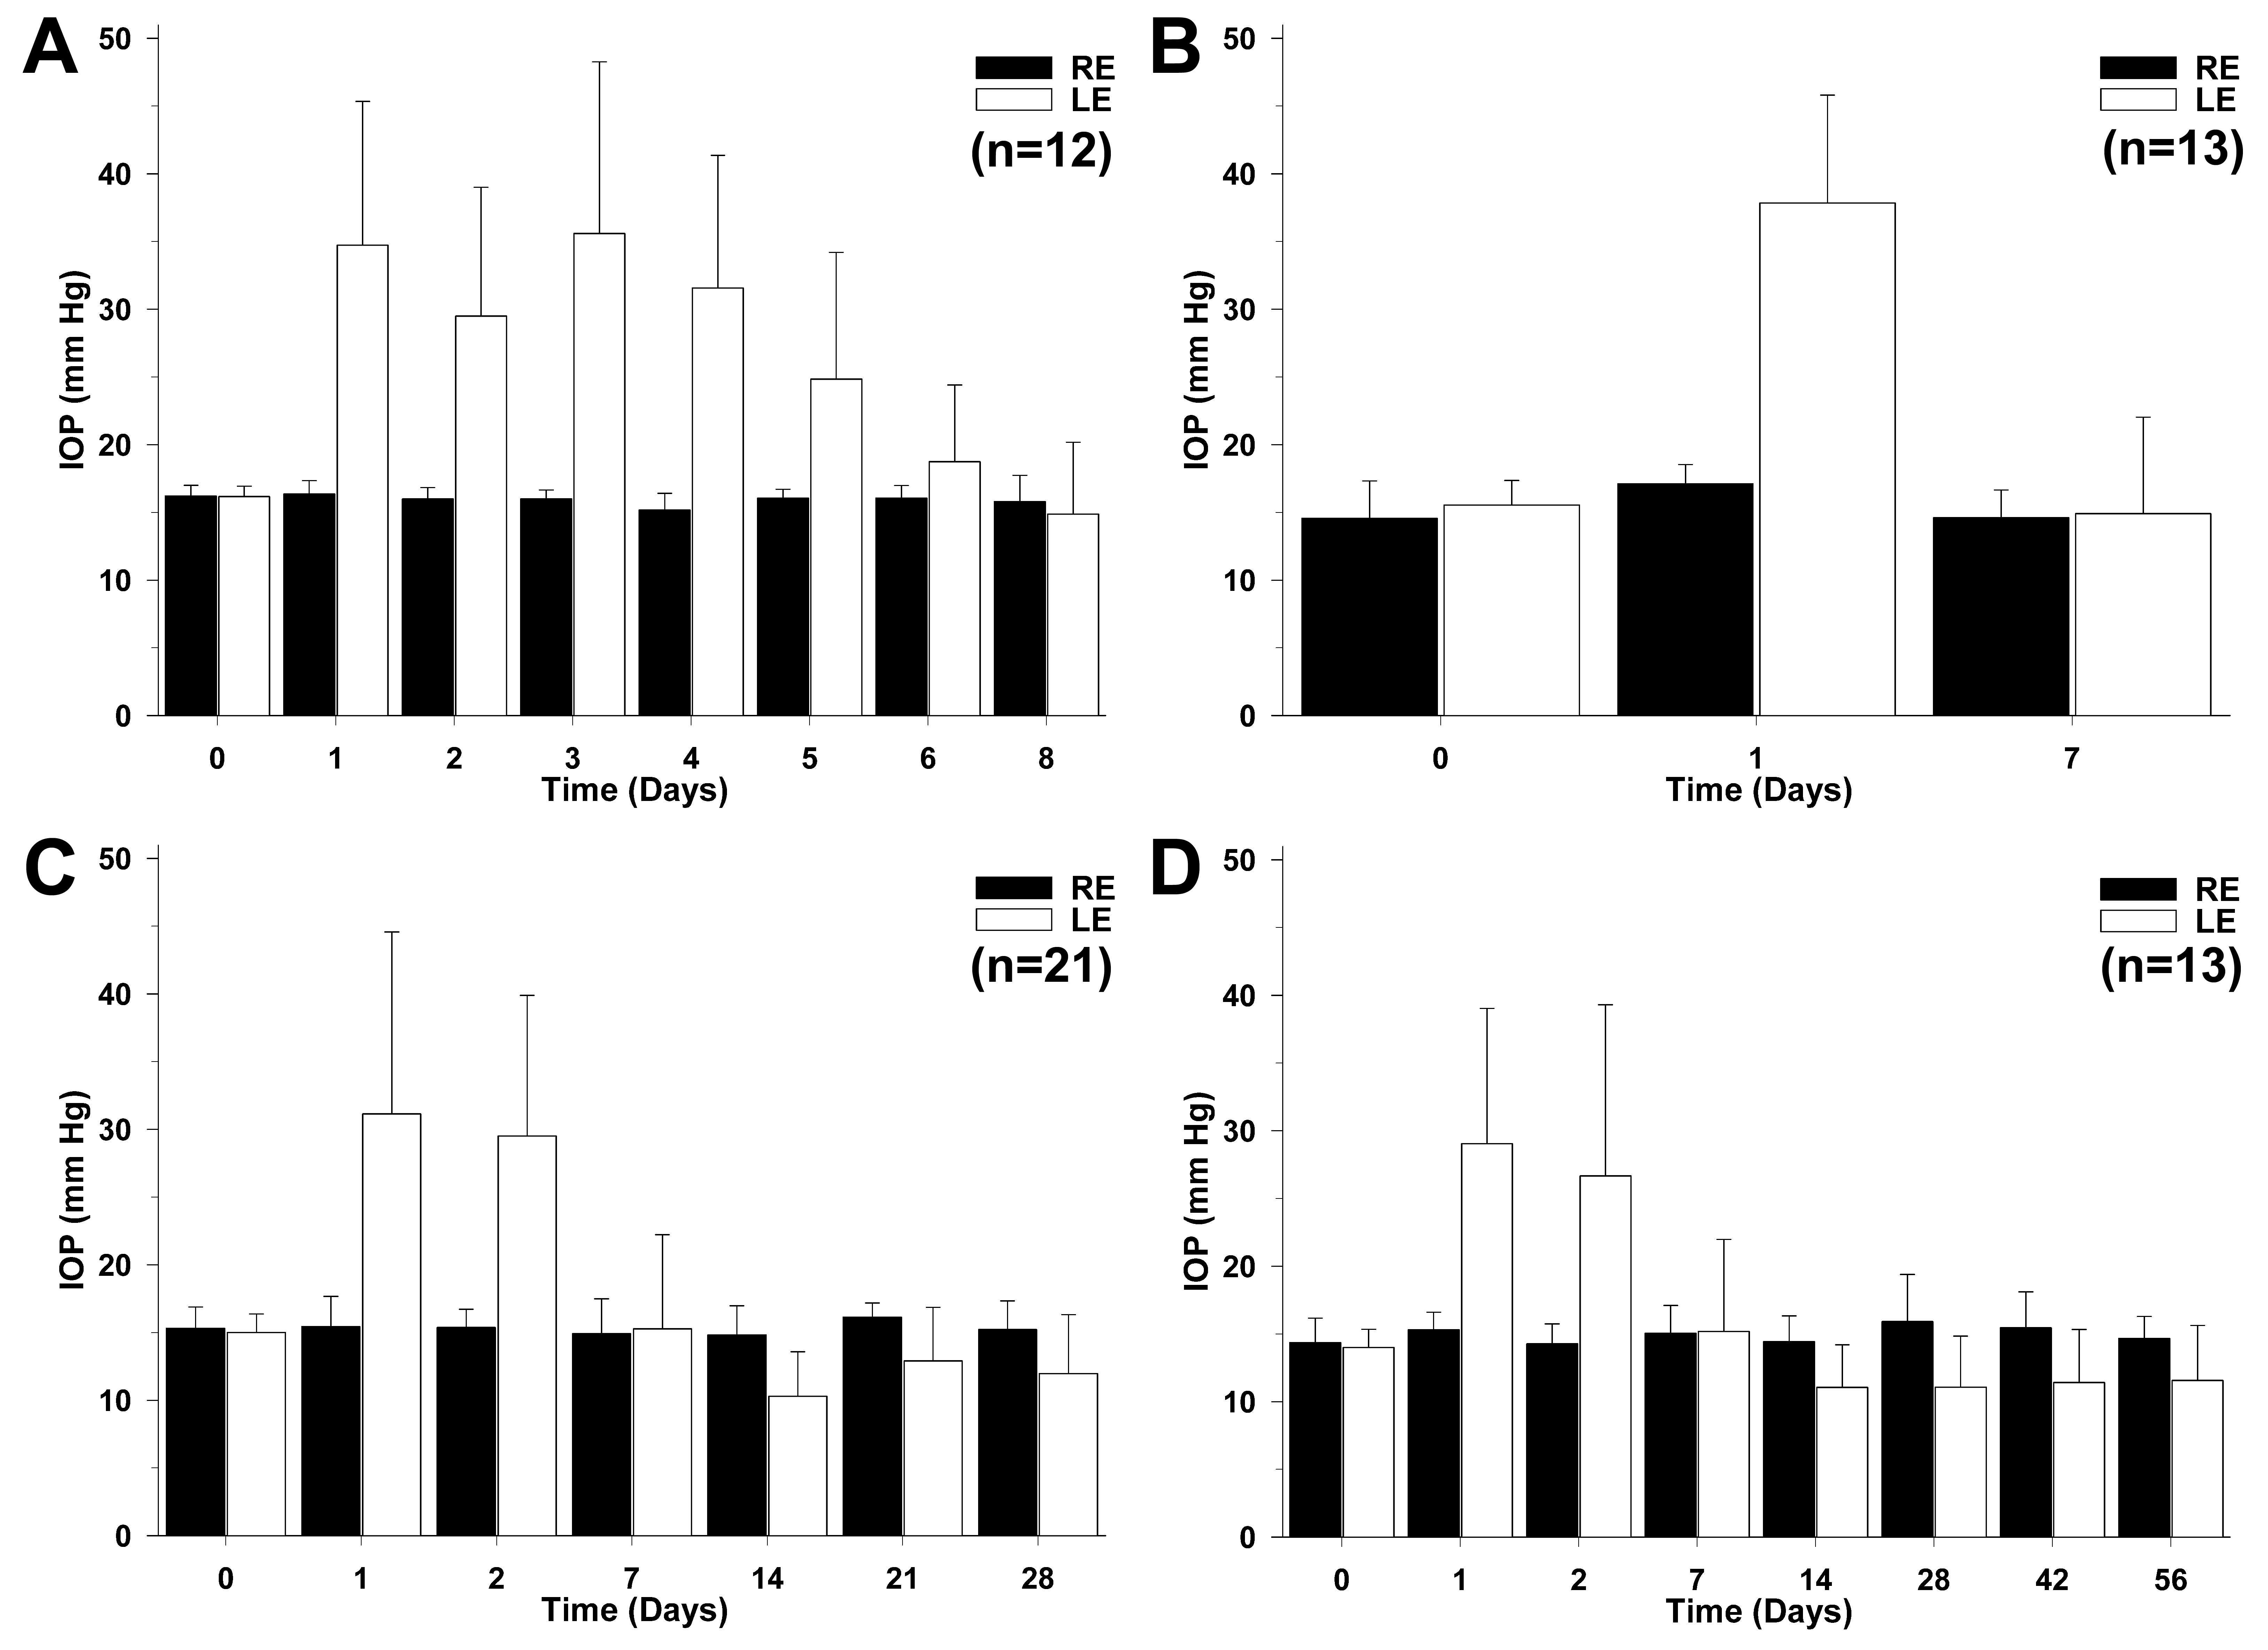
 Figure 1 of Salinas-Navarro, Mol Vis 2009; 15:2578-2598.