Figure 8. Immunofluorescence detection in
differentiated E13.5 and E17.5 RPCs. After 8 days of differentiation,
the expression of Brn3b (panel A, B), Map2
(panel C, D), GFAP (panel E, F),
glutamine
synthetase (panel G, H), and Rhodopsin (panel
I, J) in E13.5 and E17.5 RPCs was investigated. K
is the statistical ratio of positive cells in both RPCs. Note that the
expression ratios of Brn3b and MAP2 in E13.5 RPCs were
significantly higher than in E17.5 RPCs. In contrast, E17.5 RPCs
expressed GFAP, glutamine synthetase (GS), and rhodopsin
in higher percentages. The values were mean±standard deviation from
three experiments. The symbols * and ** represent p<0.05 and
p<0.01, respectively, versus E13.5 RPCs. Bars were 20 μm. The
significance was evaluated by the Student t-test.
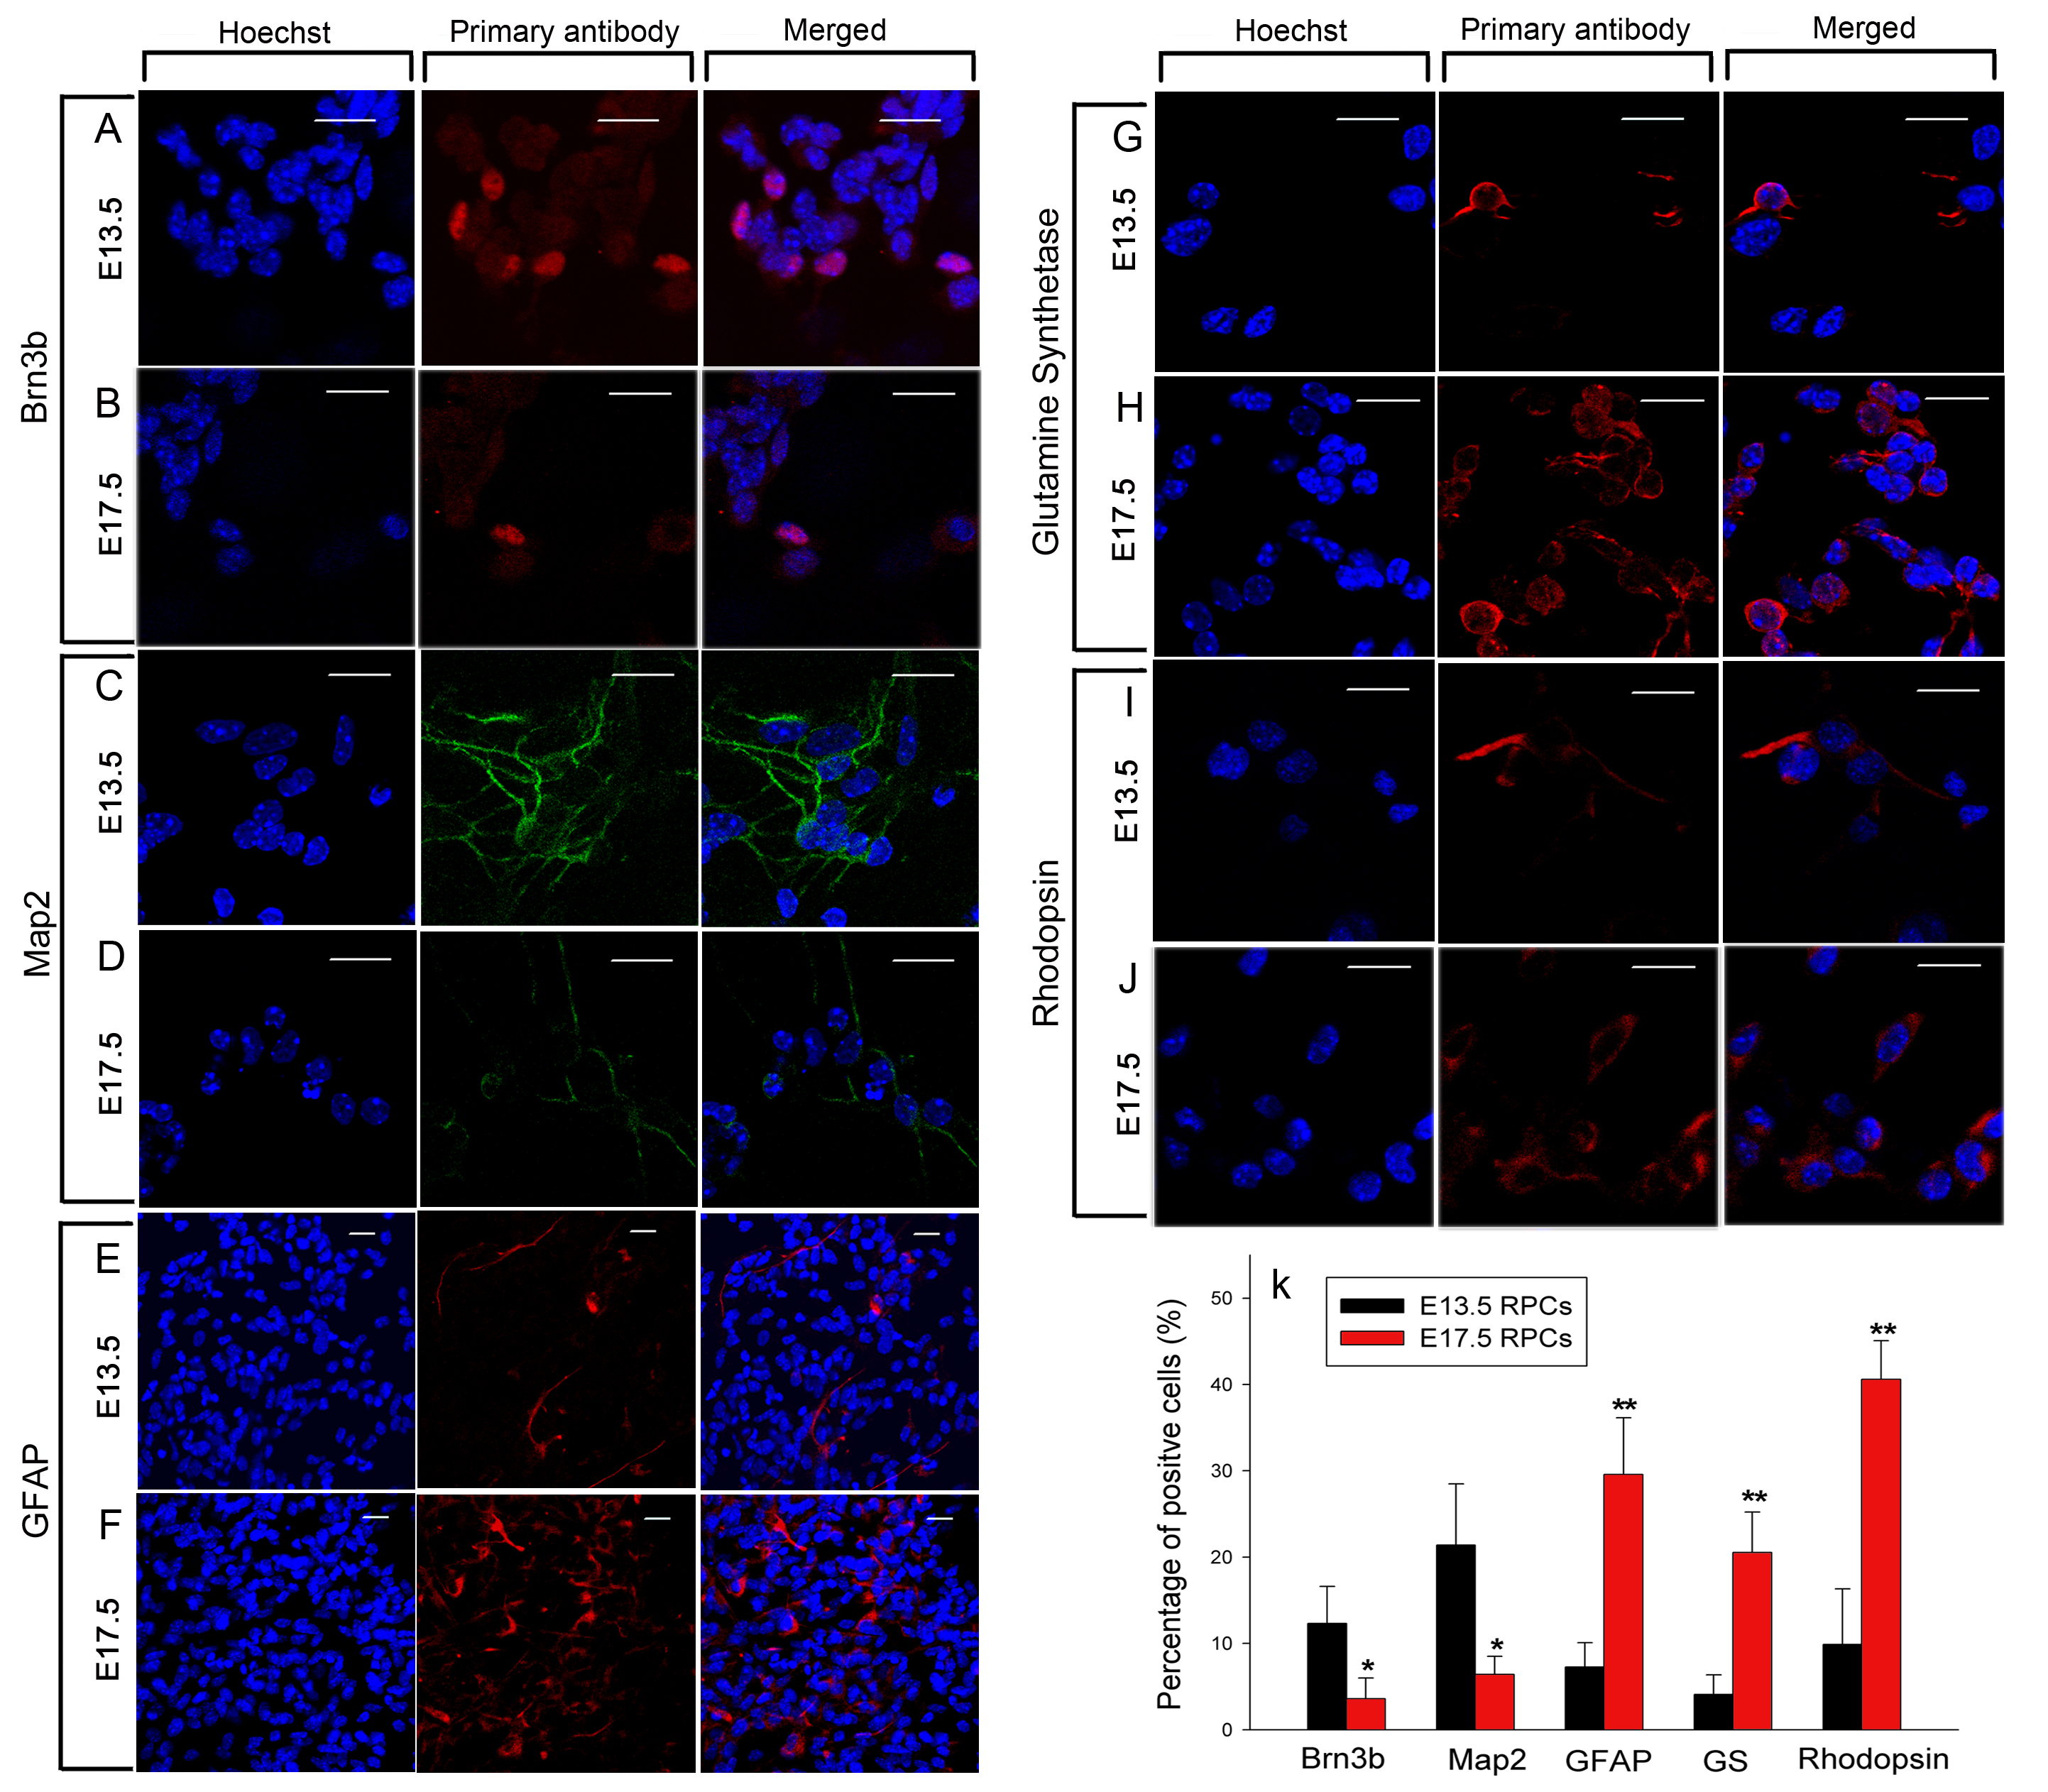
 Figure 8 of Sun, Mol Vis 2009; 15:2503-2514.