Figure 7. RGCs-related genes expression in
E13.5 RPCs during 8 day proliferation culture The “X” letter in the
y-axis represents Brn3b, Math5, or Islet1. GAPDH served
as an internal control. Note that the expression of Brn3b, Math5,
and
Islet1 weakly increased after 4 day culturing, followed by
a dramatic decrease after 8 day. Data was mean±standard deviation (n=3).
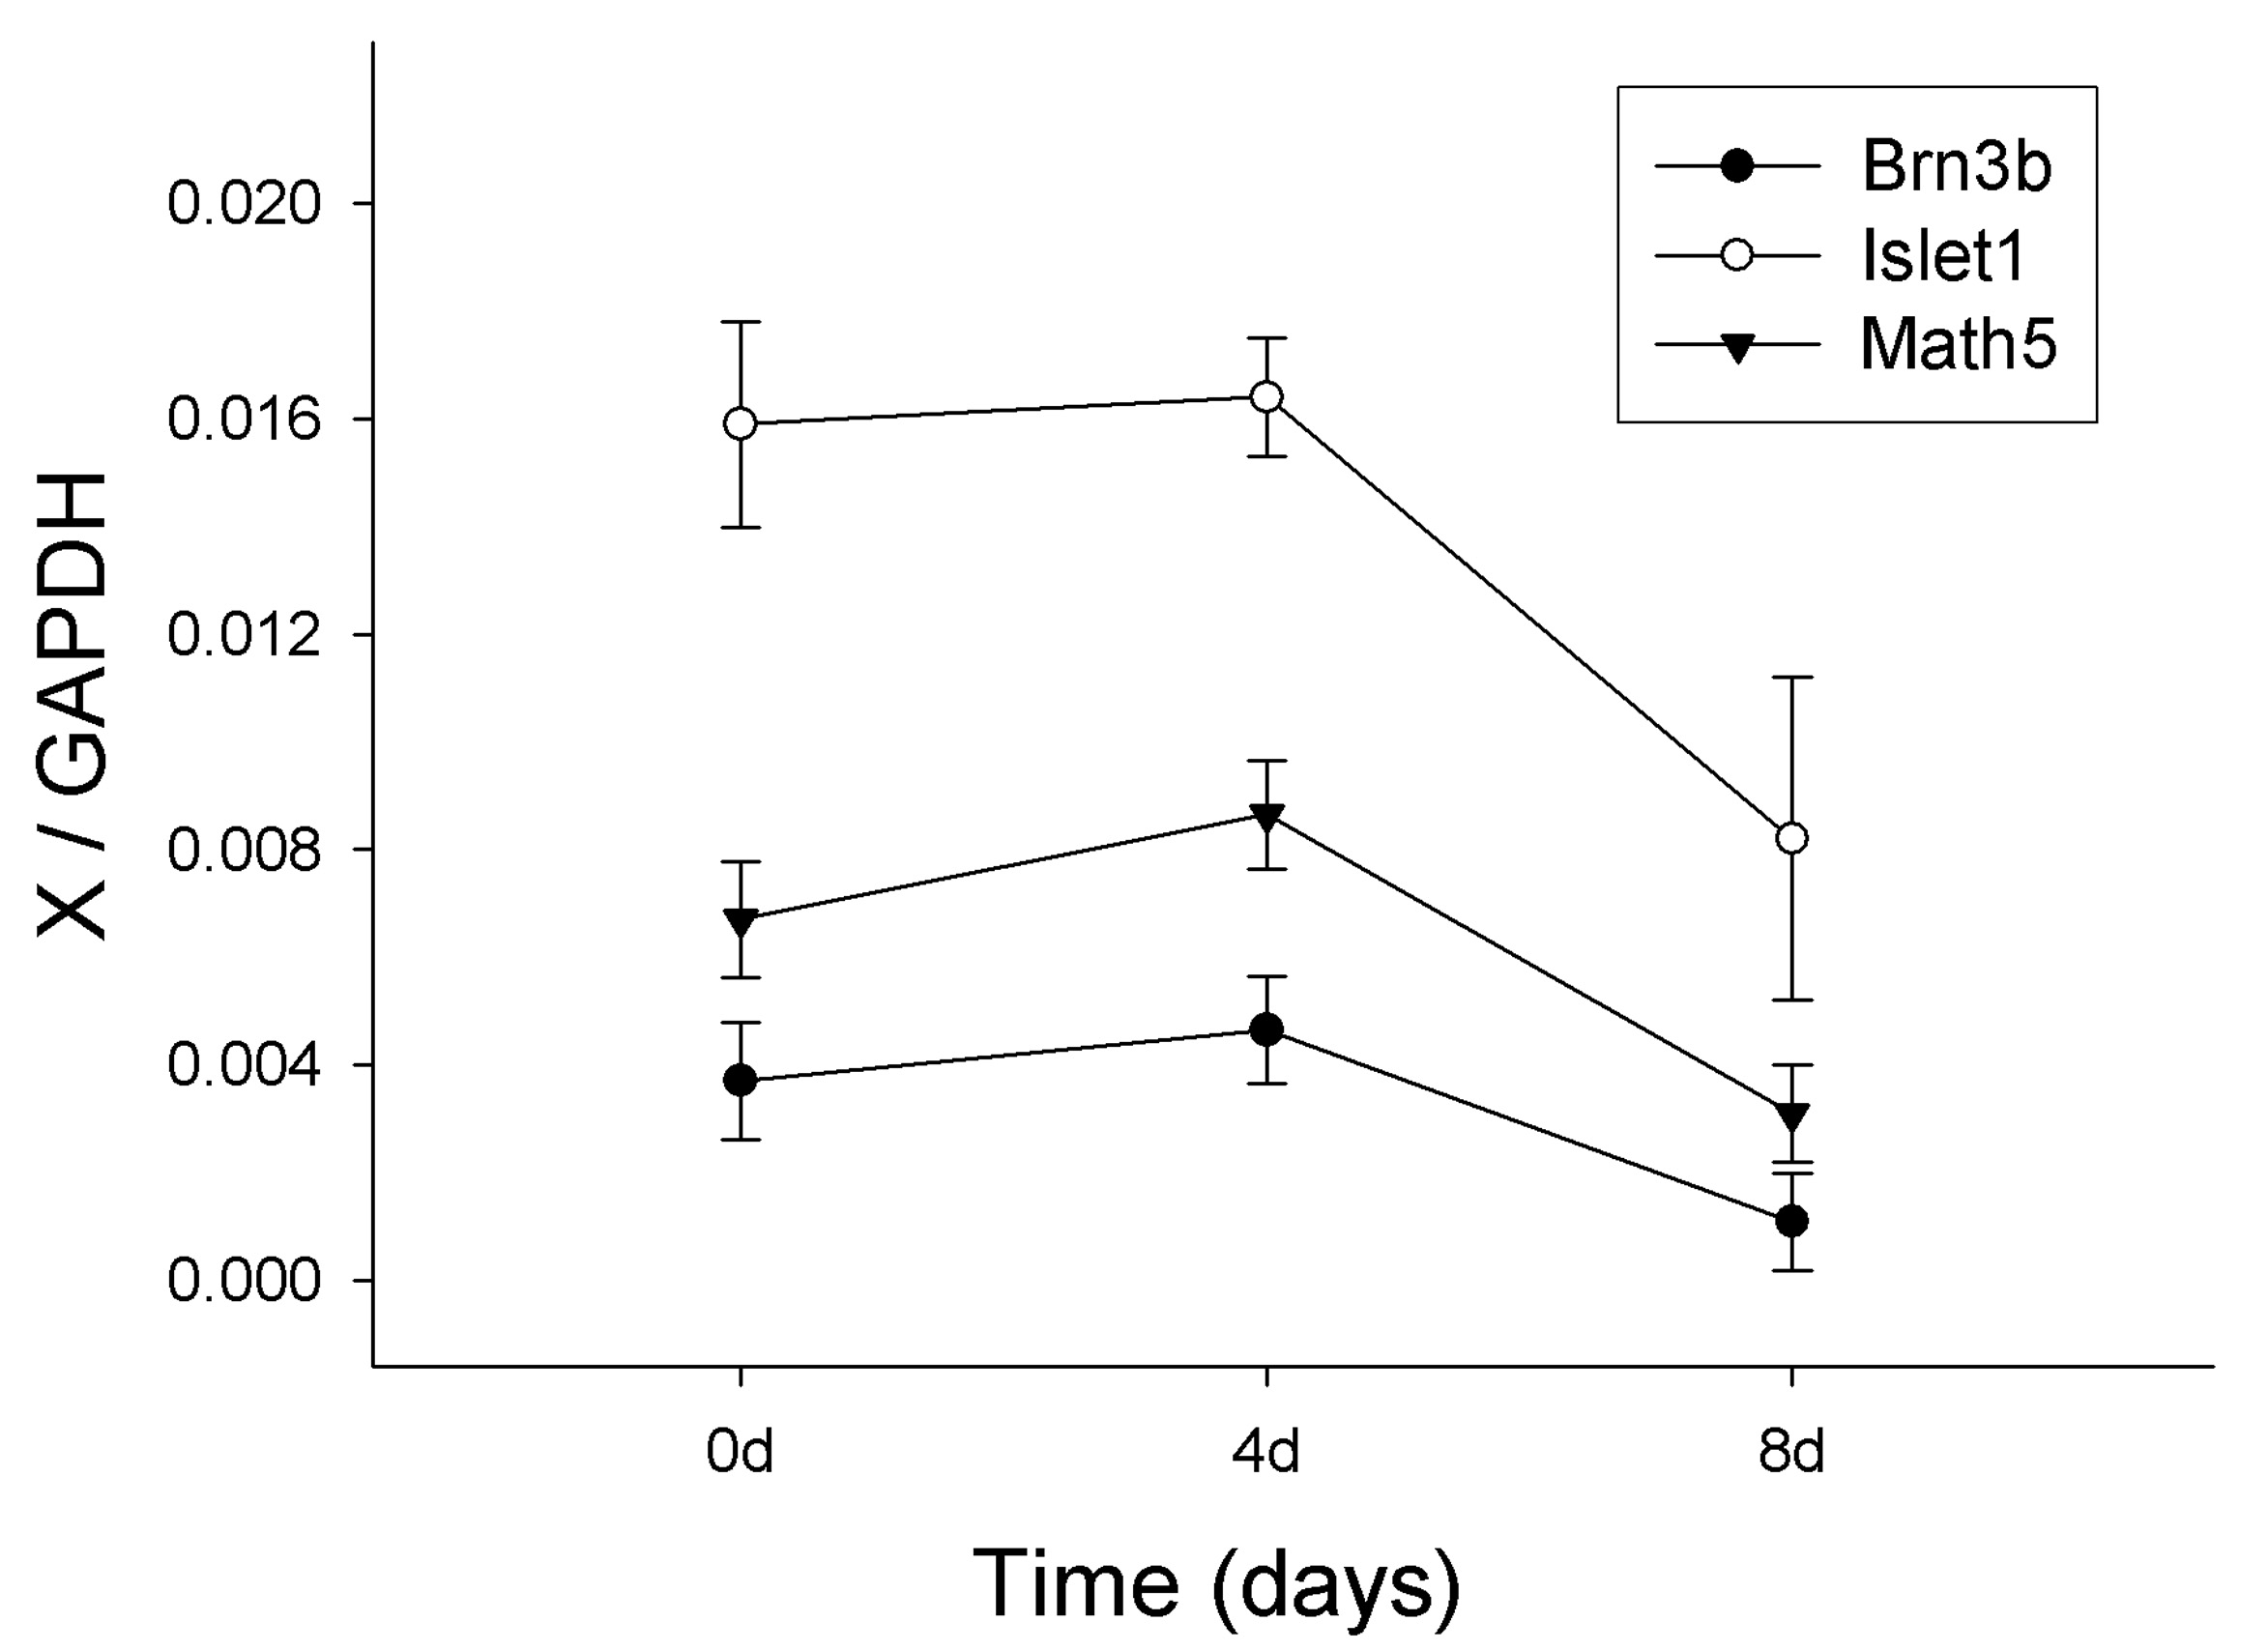
 Figure 7 of Sun, Mol Vis 2009; 15:2503-2514.