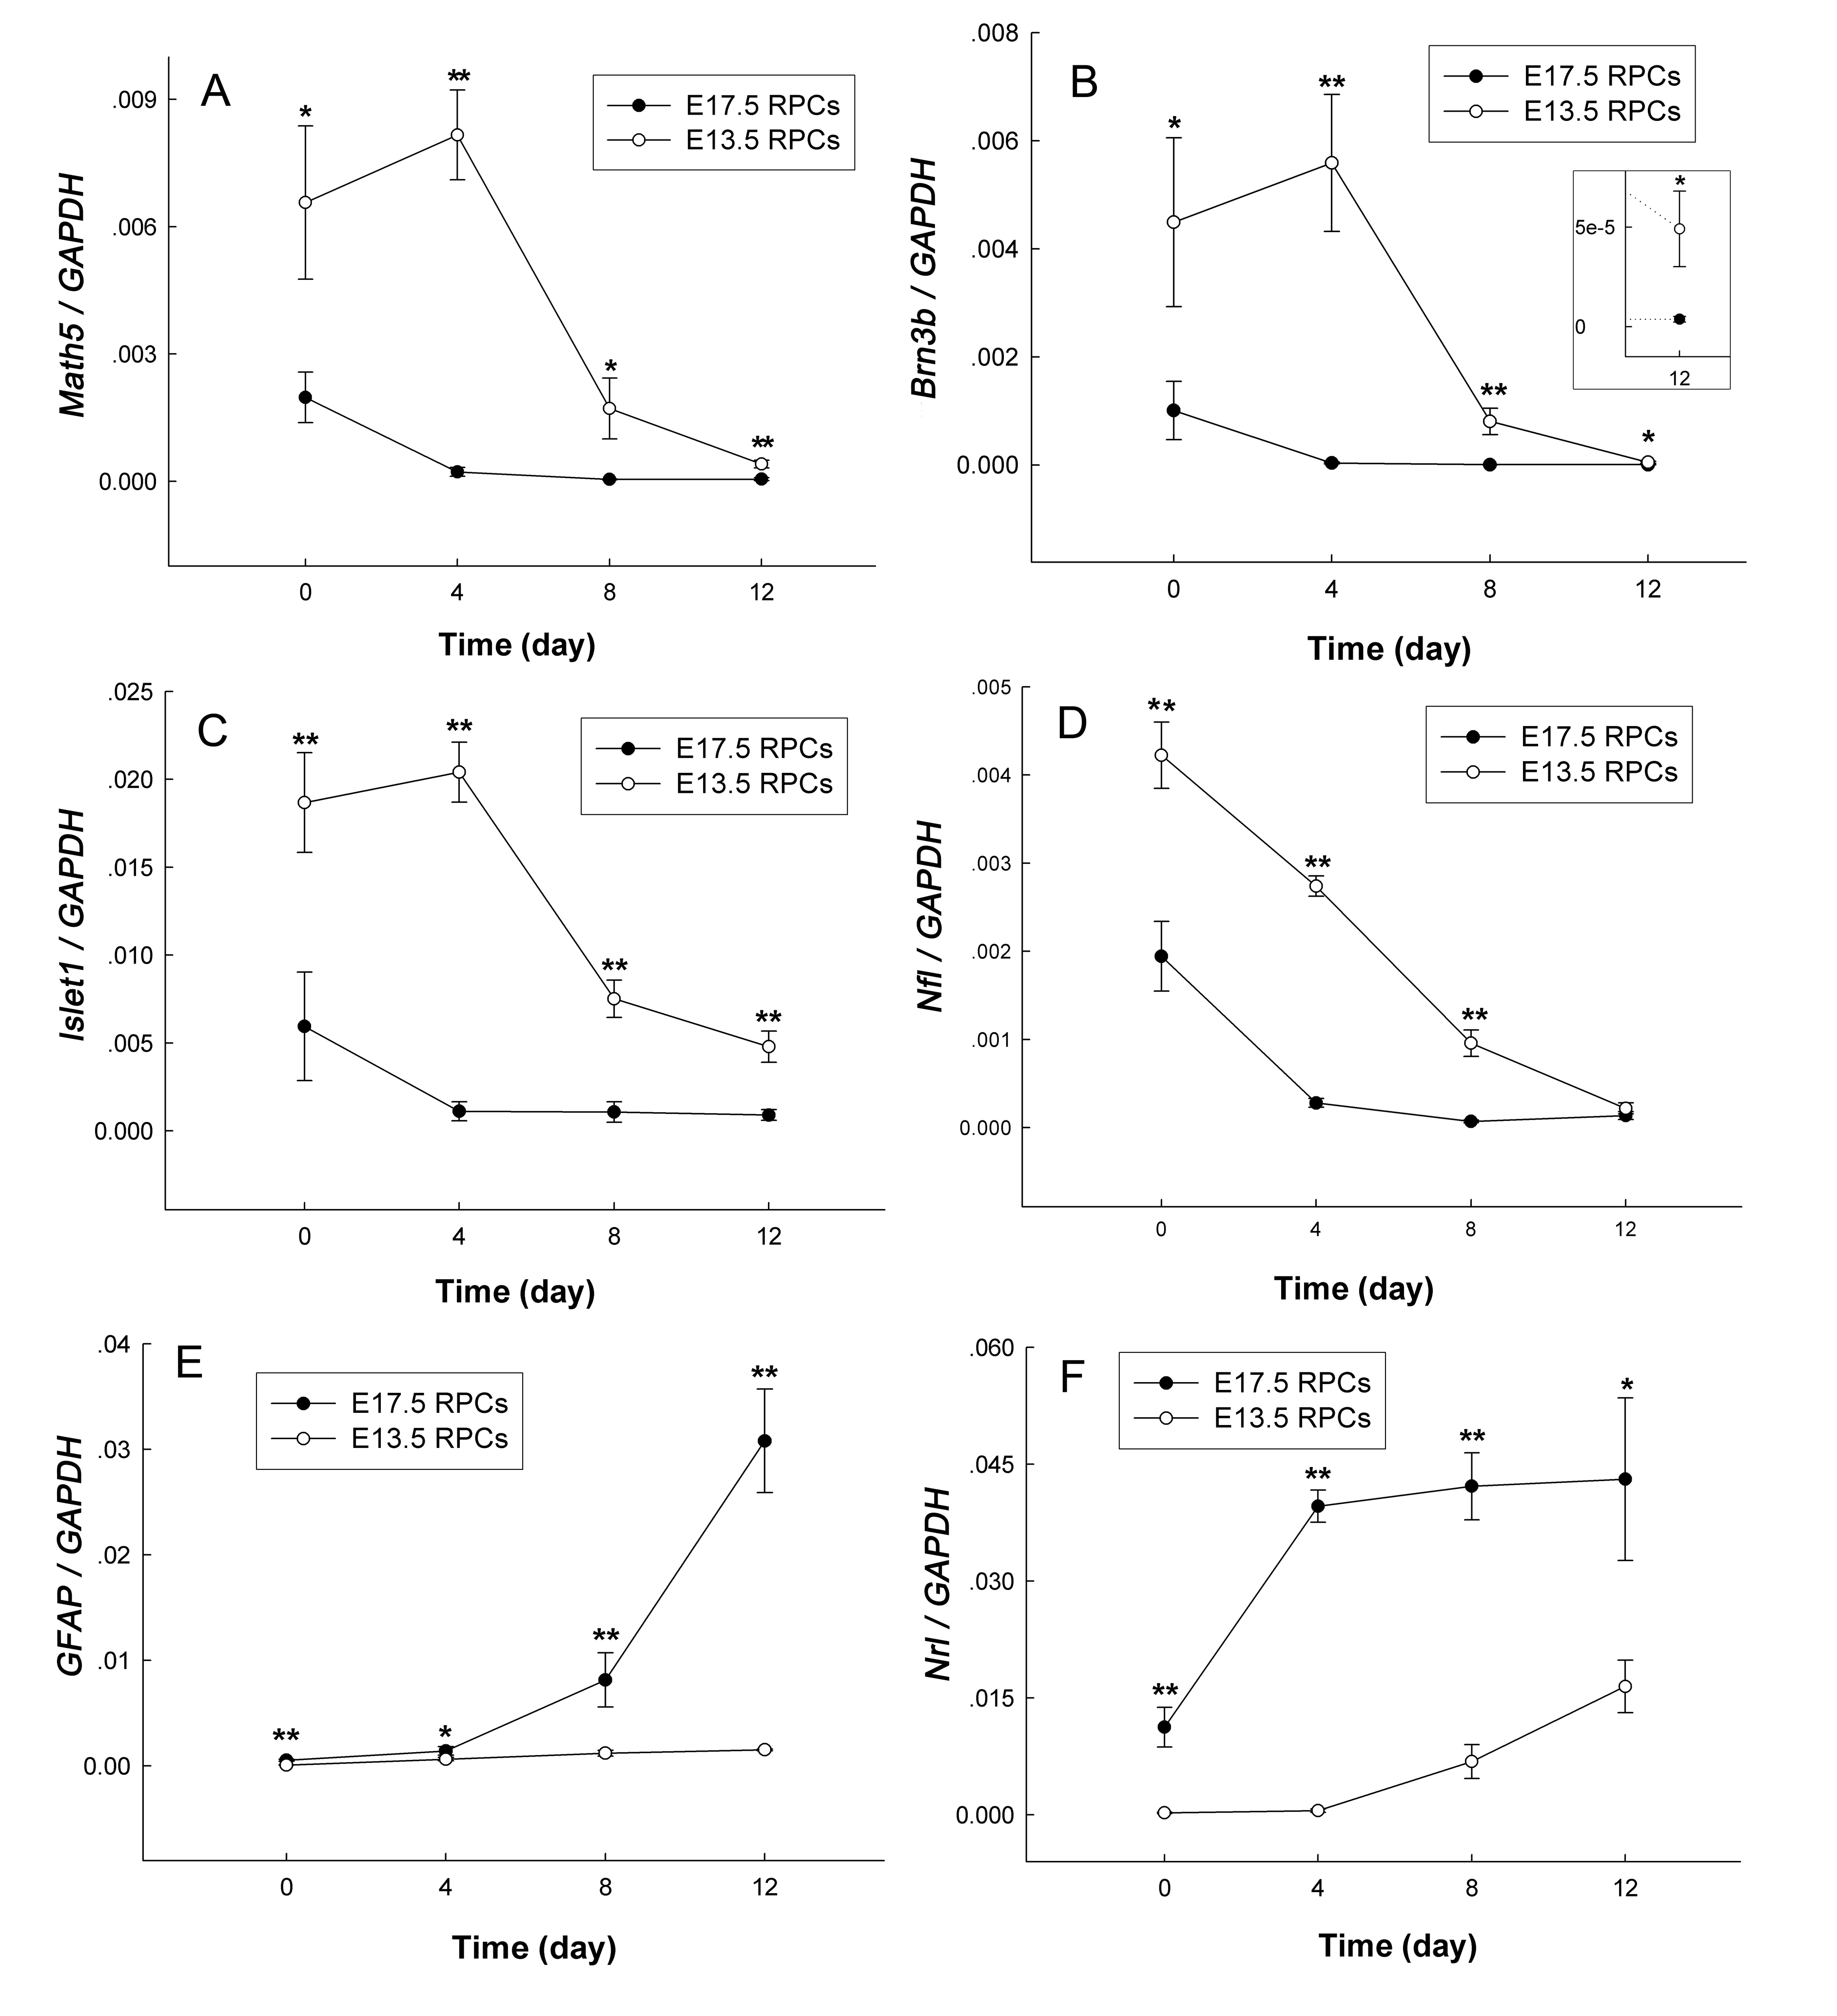
Figure 6. Gene expression in E13.5 and
E17.5 RPCs under conditions of proliferation and differentiation
culture. At 0 d: freshly harvested RPCs; 0–4 d: proliferation culture;
4–12 d: differentiation culture. (The detailed experimental procedure
is shown in
Figure 5.)
GAPDH, a housekeeping gene, served as an internal control. The
insert in panel
B was the local magnification at 12 days. Note
the deviation bars at some points were almost indiscernible due to the
large scale of the y-axis. The values were mean±standard deviation from
three experiments. The symbols * and ** represent p<0.05 and
p<0.01, respectively, versus E17.5 RPCs (
A-D) or E13.5 RPCs (
E-F).
The
significance was determined by the Student
t-test.
 Figure 6 of Sun, Mol Vis 2009; 15:2503-2514.