Figure 1. Gene expression in freshly
harvested or proliferation-cultured E13.5 retinal progenitor cells
(RPCs) relative to fresh E17.5 RPCs. Expression of each gene in freshly
harvested E17.5 RPCs was defined as 1. The columns represent the
relative expression level in E13.5 RPCs, which were either freshly
harvested (black column) or proliferation-cultured for 4 days (red
column). Panel A shows the genes whose initial expression was
high in fresh E13.5 RPCs, but mostly decreased after 4 days culture.
Panel B represents those genes whose initial expression was low
in fresh E13.5 RPCs, but increased after 4 days culture. Note that the
expression change of Math5, Brn3b, and Islet1 in E13.5
RPCs was exceptional. The symbols * and ** represent p<0.05 and
p<0.01, respectively, versus fresh E17.5 RPCs. The symbols # and ##
represent p<0.05 or p<0.01, respectively, versus fresh E13.5
RPCs. Data was mean±standard deviation (n=4). The significance was
estimated by one-way ANOVA.
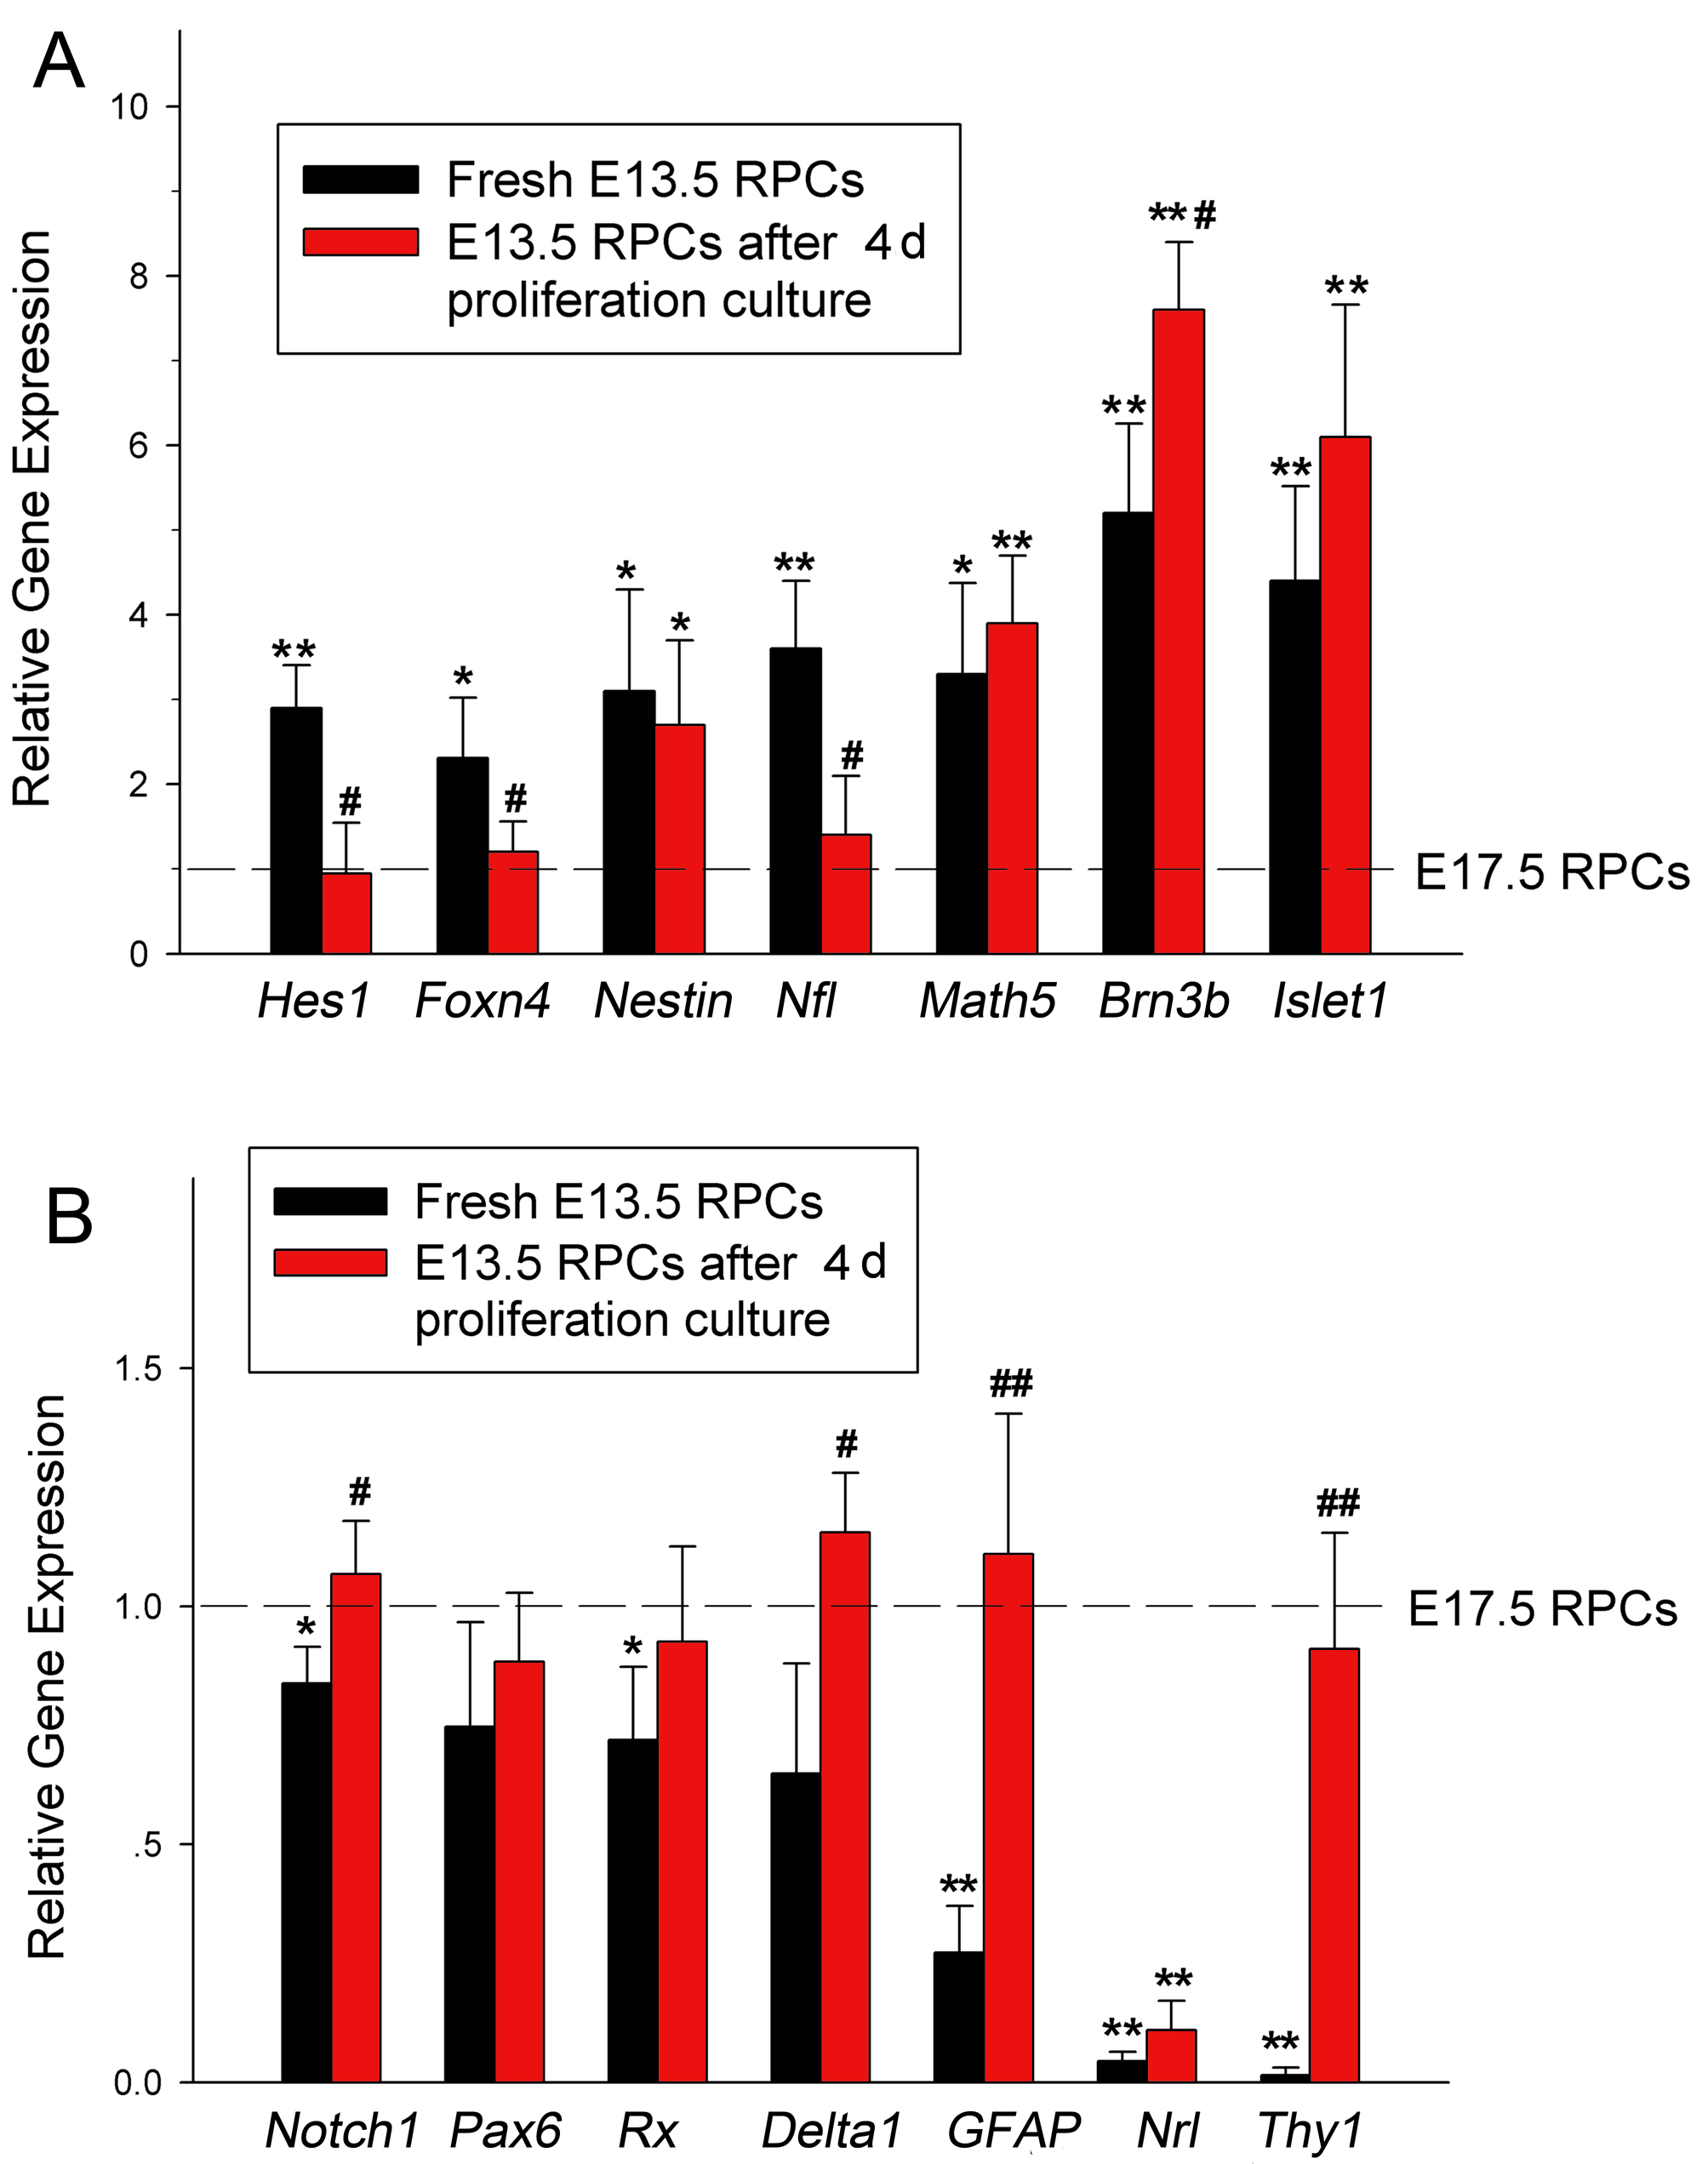
 Figure 1 of Sun, Mol Vis 2009; 15:2503-2514.