Figure 3. Targeting of the
3’-unstranslated regions of BMP1, ADAM12, and NKIRAS2
by miR-29b. A: Predicted interactions between miR-29b with the
3’-unstranslated region (3’ UTR) of BMP1 (PicTar-Vert), ADAM12
(TargetScan), and NKRAS2 (PicTar-Vert). Seed regions are
highlighted in bold. B: Luciferase activity in 293 cells
cotransfected with psicheck vectors containing the 3’UTR or
complementary sequence (R) from BMP1, ADAM12, or NKIRAS2
and miR-29b or scramble. C: Changes in expression of ADAM12,
BMP1, and NKIRAS2 were measured by Q-PCR after
transfection with miR-29b mimic or scramble. The figures represent the
logarithm of the fold change in gene expression compared to cells
transfected with scramble in three different cells lines. Bars
represent standard error from three different experiments; one asterisk
indicates a p≤0.05, and two asterisks indicate a p≤0.01.
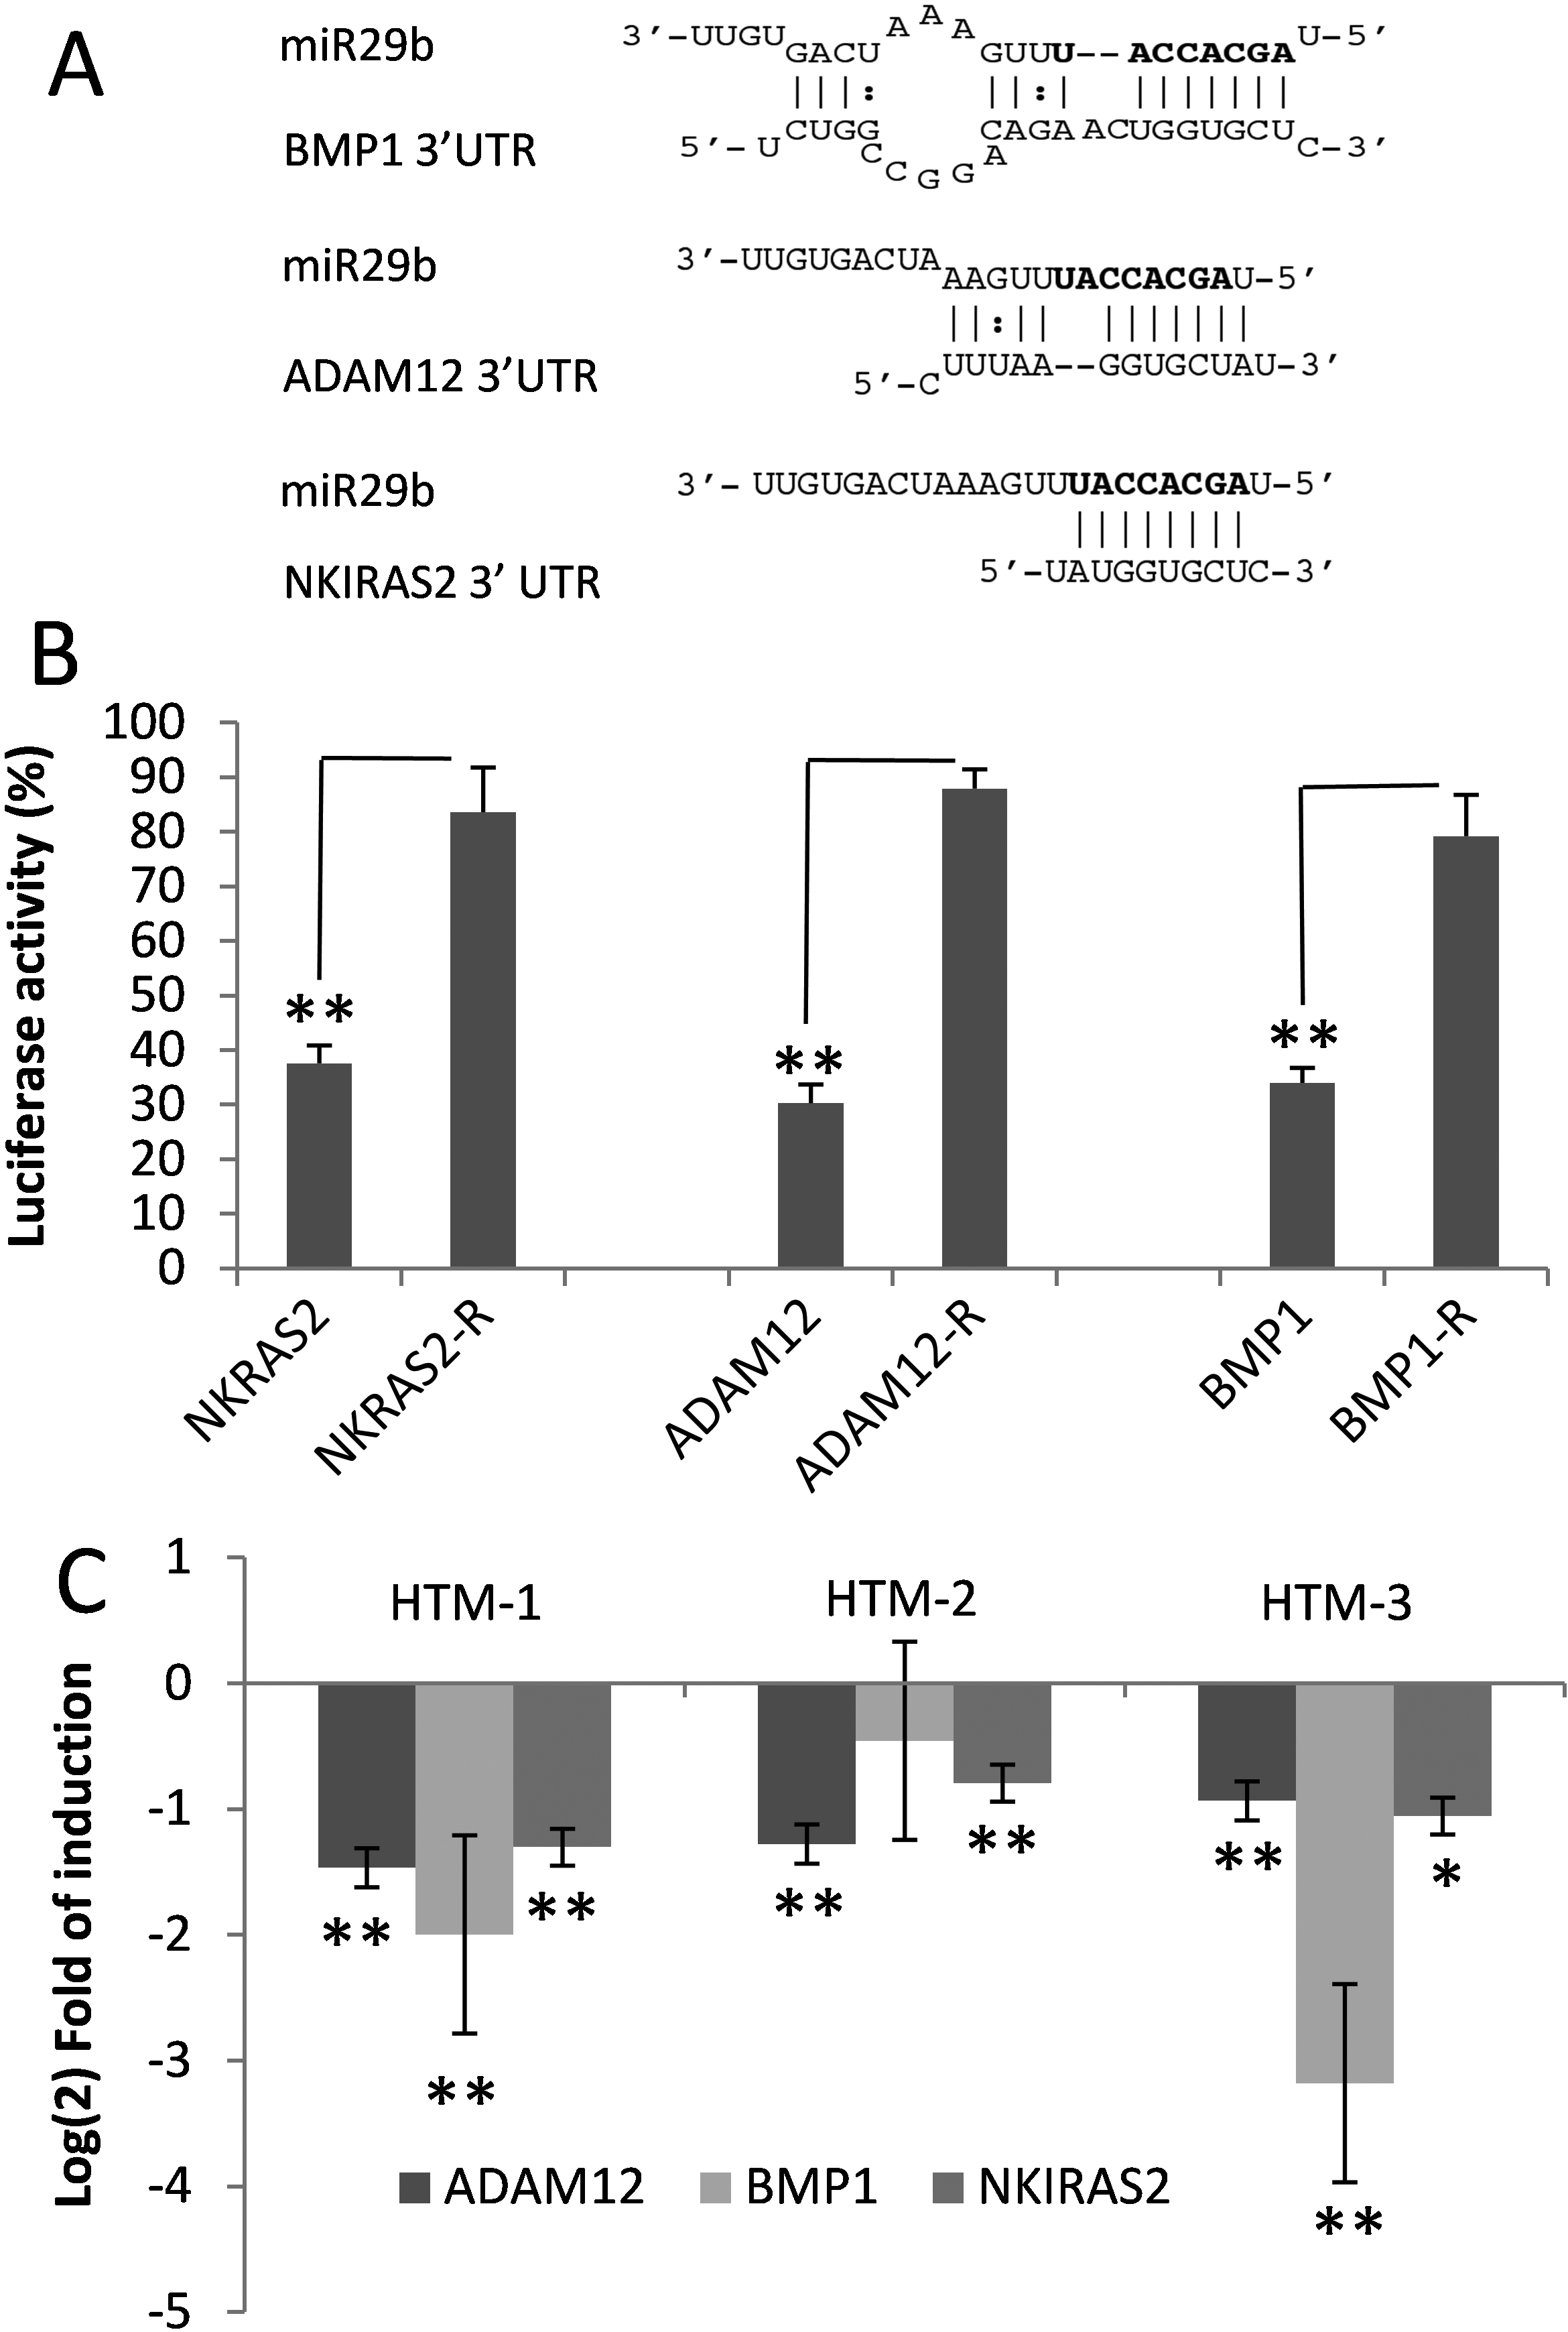
 Figure 3 of Luna, Mol Vis 2009; 15:2488-2497.