Figure 2. Genes known to be regulated by SP1 that showed significant differences in expression after transfection with miR-29b mimic
by array analysis. Metacore analysis of the genes showing significant differences (p<0.5) in expression in the Affymetrix
U133A2 arrays identified SP1 as the transcription factor more significantly (p= 4.82 E-106) associated with these gene expression
changes. Green lines represent upregulation by SP1, red lines a downregulation, and gray lines an unspecified effect. Genes
significantly upregulated in gene array analysis of cells transfected with miR-29b are labeled with red dots. Genes significantly
downregulated by miR-29b are labeled with blue dots. Inconsistencies between the array data and the effects predicted by Metacore
based on the literature are labeled with a star.
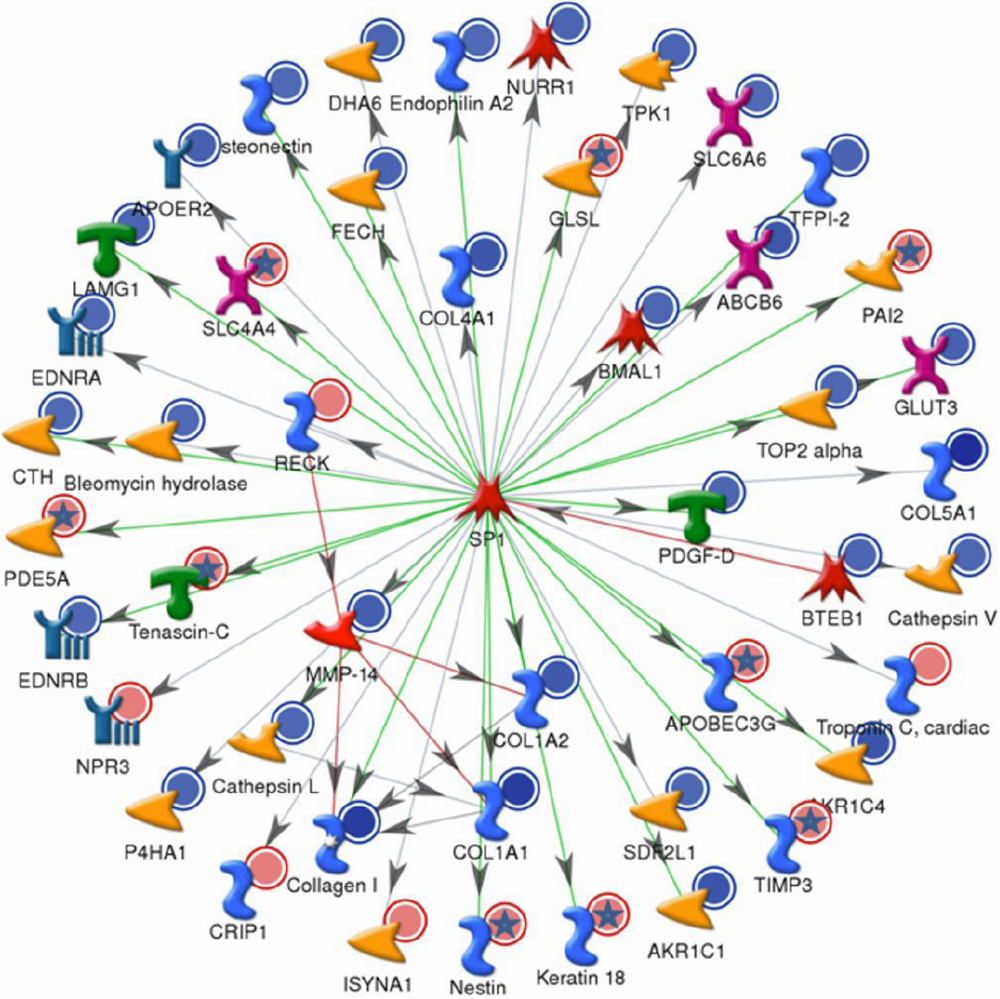
 Figure 2 of
Luna, Mol Vis 2009; 15:2488-2497.
Figure 2 of
Luna, Mol Vis 2009; 15:2488-2497.