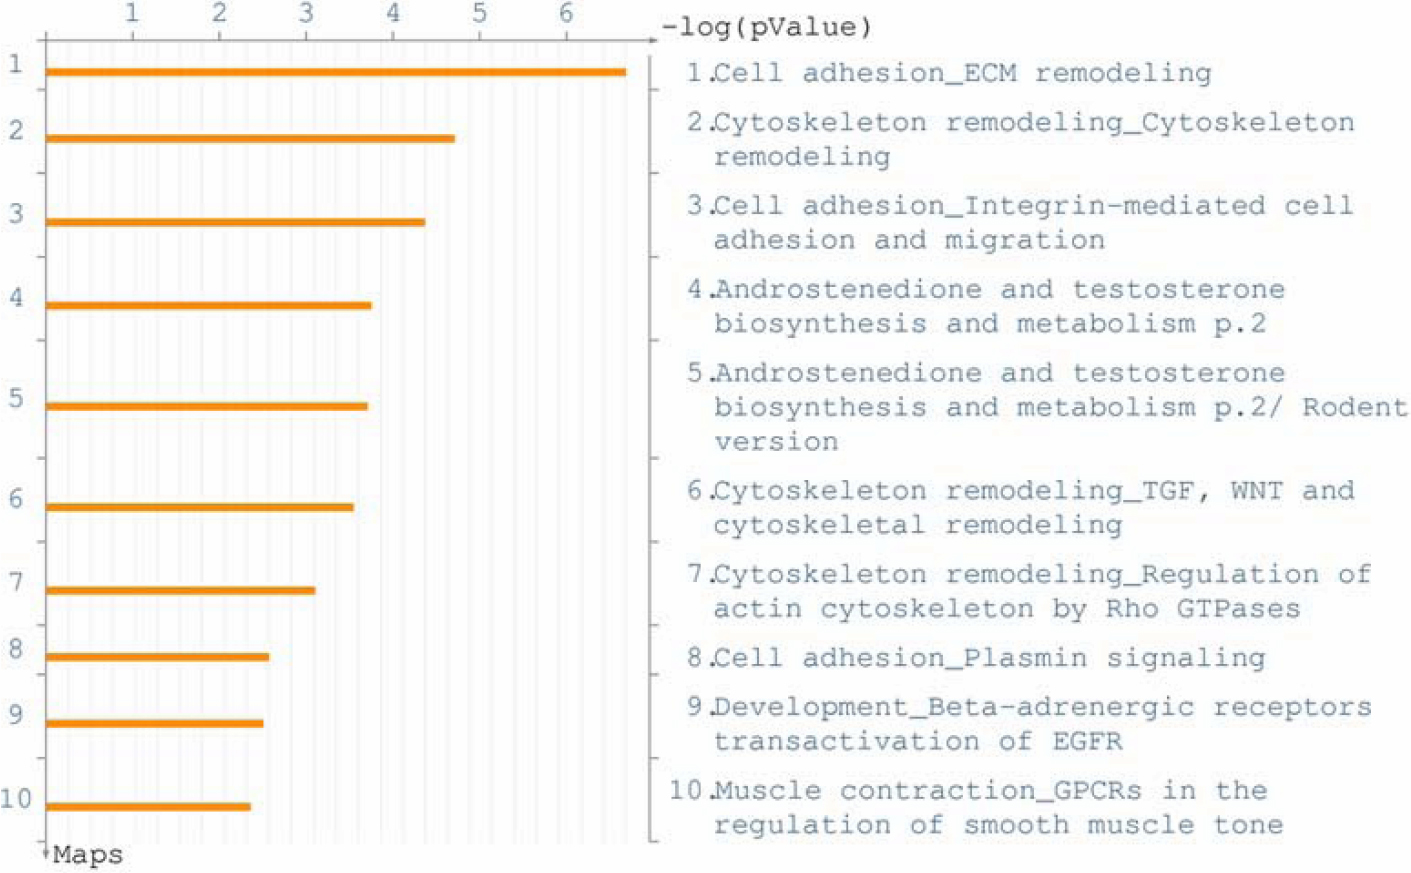
Figure 1. Pathway analysis of changes in gene expression induced by miR-29b. Genes showing changes in expression higher than 1.5 fold
(p<0.05) after transfection with miR-29b mimic using Affymetrix U133A2 arrays were analyzed with Metacore pathway analysis.
The canonical pathway maps used in this analysis represent a set of 650 signaling and metabolic maps generated from the
GeneGo database (GeneGo,
St. Joseph, MI). The figure shows the 10 canonical pathways most significantly affected by transfection with miR-29b mimic
compared to controls. In the figure, ECM represents extracellular matrix; TGF represents transforming growth factor; EGFR
represents epidermal growth factor; and GPCRs represents G protein-coupled receptors.
 Figure 1 of
Luna, Mol Vis 2009; 15:2488-2497.
Figure 1 of
Luna, Mol Vis 2009; 15:2488-2497.