Figure 1. Partial nucleotide sequence of VSX1 exon 3. Partial exon 3 nucleotide sequence of VSX1 showing G→C transition in the mutated allele of the patient (P) in comparison to control (C). RP represents a partial chromatogram
of the reverse nucleotide sequence of the patient in comparison to control (RC). The arrow-head shows the position of the
change in the given sequences.
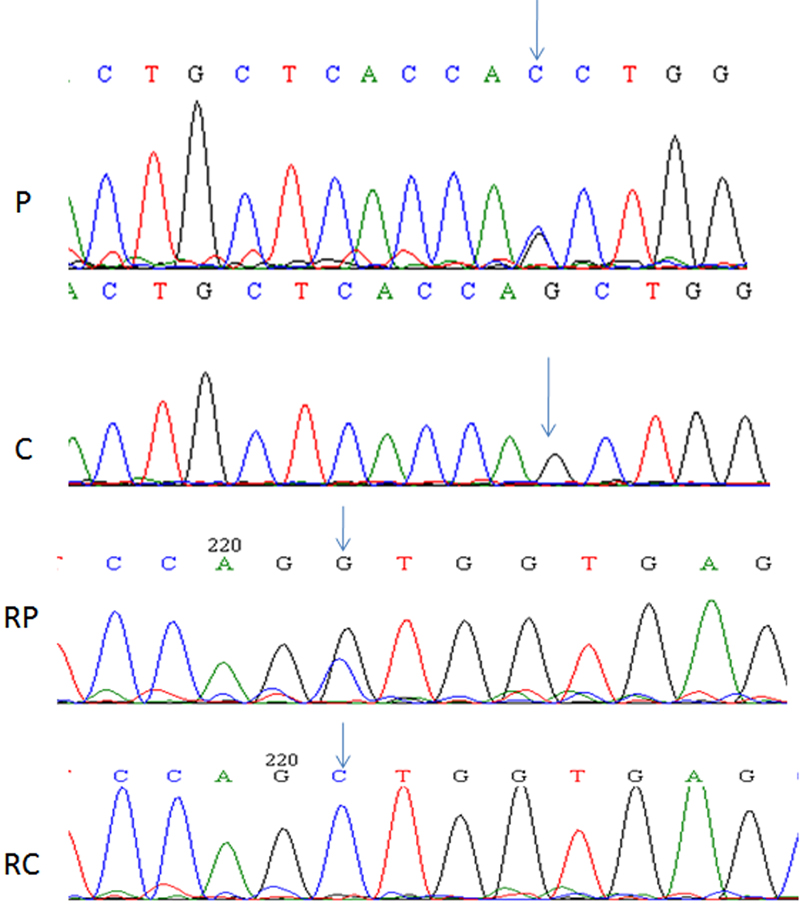
 Figure 1 of
Paliwal, Mol Vis 2009; 15:2475-2479.
Figure 1 of
Paliwal, Mol Vis 2009; 15:2475-2479.