Figure 3. Cell adhesion proteins. A: Mip, Lim2, and Cdh2 were the adhesion proteins with highest apparent abundance (together constituting ≈ 85% of identified
spectra). In B, Mip and Lim2 have been removed to help visualize the identities of adhesion proteins of lower apparent abundance. The numbers
in parentheses indicate the lens preferred expression index (LPEI, see text for details).
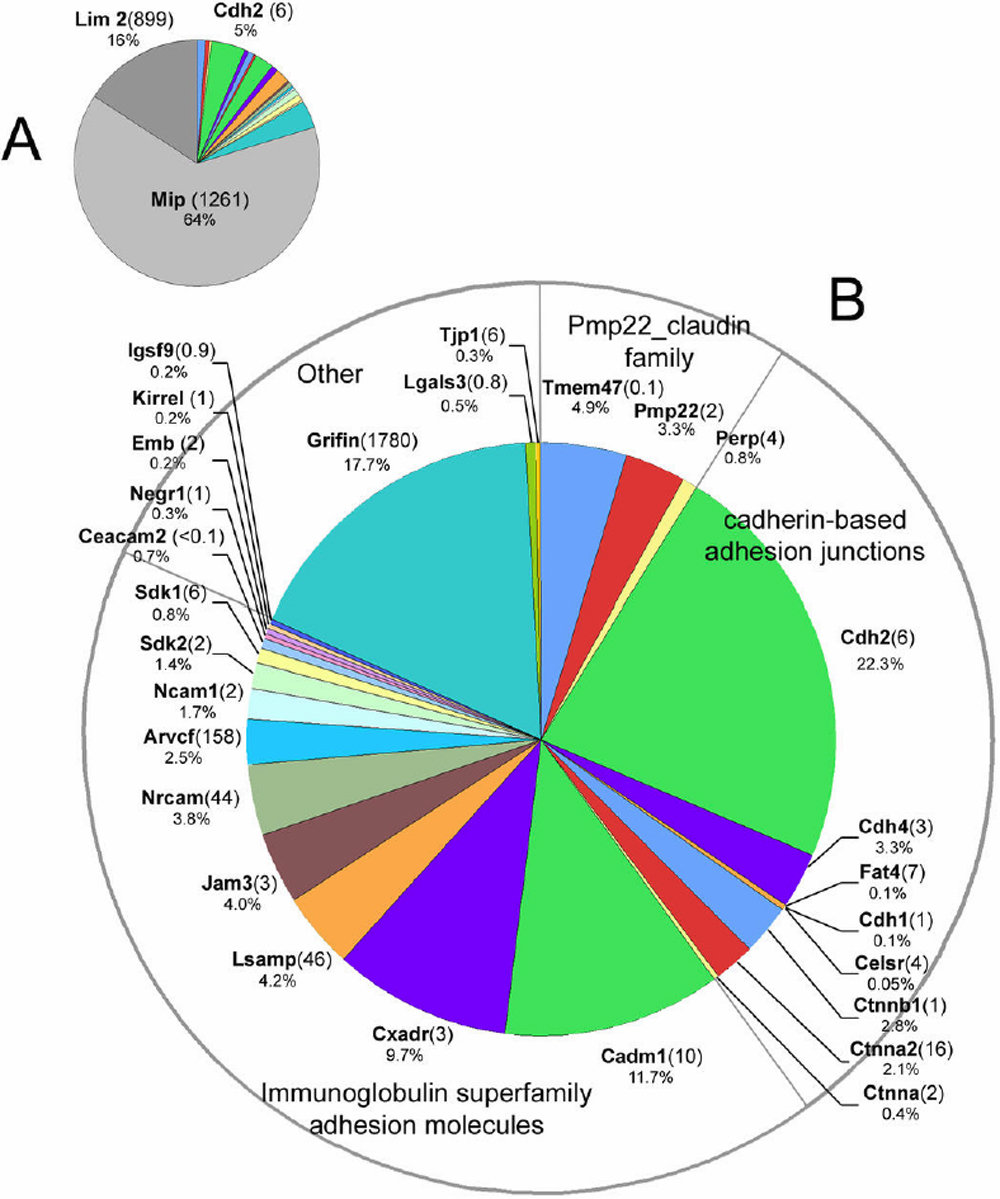
 Figure 3 of
Bassnett, Mol Vis 2009; 15:2448-2463.
Figure 3 of
Bassnett, Mol Vis 2009; 15:2448-2463.