Figure 3. Electrophysiology. Full-field
ERGs and pattern ERGs from the right (row 1) and left eye (row 2) of
the patient and normal examples (row 3) for comparison. Full-field ERGs
were performed using corneal electrodes in August 2007; pattern ERGs
had been recorded to a 30 degree field checkerboard stimulus using
periorbital surface electrodes two years earlier. Dark-adapted ERGs are
shown for flash intensities of 0.01 and 11.5 cd.s.m−2;
light-adapted ERGs for a flash intensity of 3.0 cd.s.m−2 at
30 Hz (flicker) and at 2 Hz.. ON-OFF ERGs used an orange stimulus (560
cd.m−2, duration 200 ms) superimposed on a green background
(150 cd.m−2). S-cone ERGs used a blue stimulus (445 nm, 80
cd.m−2) on an orange background (620 nm, 560 cd.m−2).
Eye movement artifacts are replaced by broken lines for clarity. S-cone
ERGs were unavailable for the right eye.
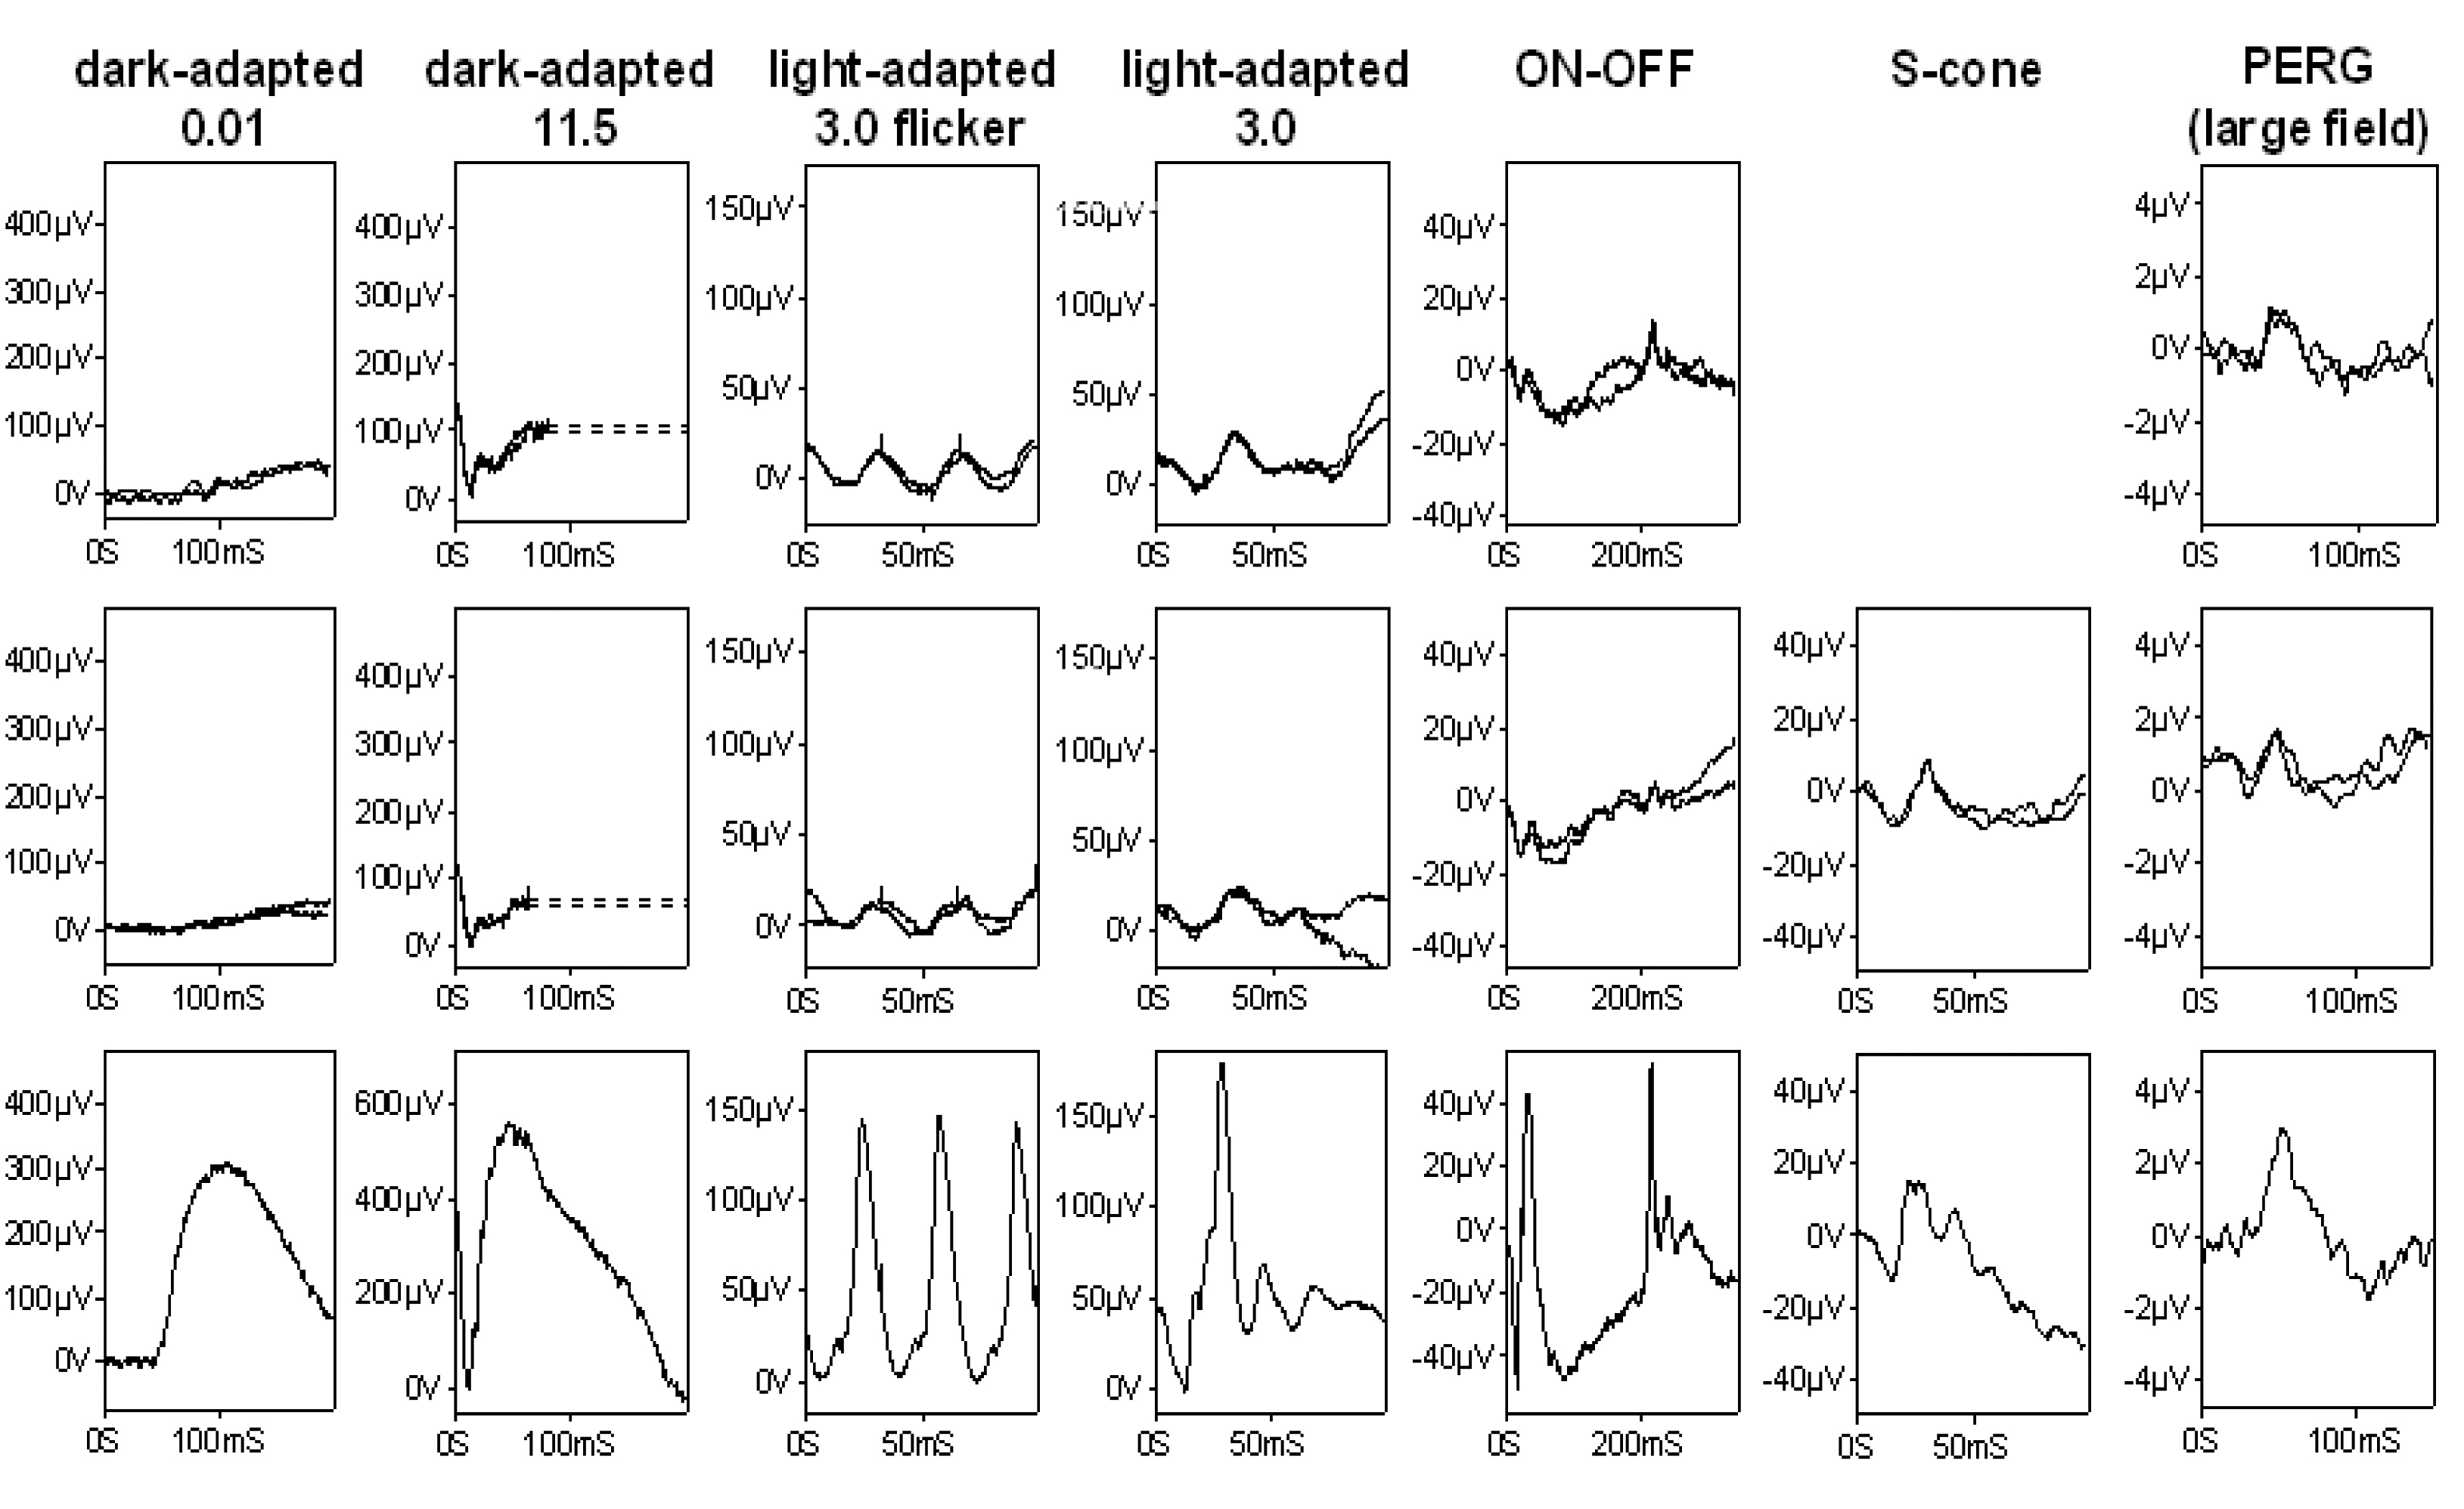
 Figure 3 of Henderson, Mol Vis 2009; 15:2442-2447.