Figure 5. The results of ELISA showed the release of IL-6 and IL-8 from HCFs under different stimulation. Data are the mean±SEM of triplicates
from an experiment that was repeated three times with similar results. The asterisk indicates p<0.05 versus the control, and
p<0.05 versus 10 μg/ml hydrocortisone.
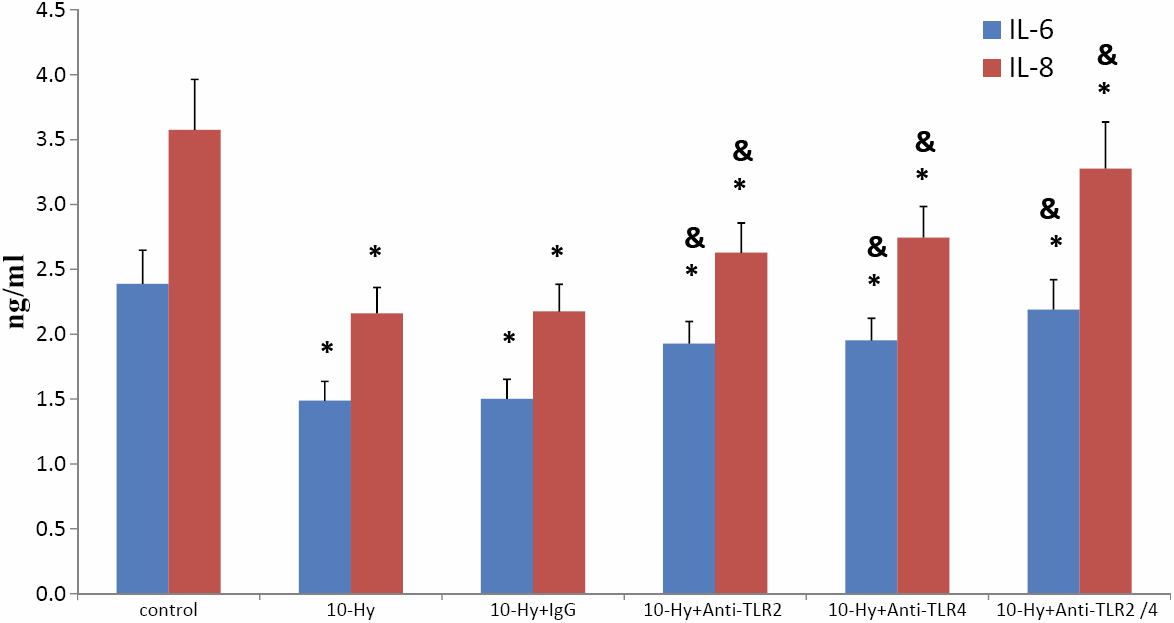
 Figure 5 of
Jin, Mol Vis 2009; 15:2435-2441.
Figure 5 of
Jin, Mol Vis 2009; 15:2435-2441.