Figure 4. The expression of TLR2, TLR4, and pIκB-α under stimulation. A: Western blot analyses detect the expression of TLR2, TLR4, and pIκB-α at the protein level in HCFs under stimulation of
10 μg/ml hydrocortisone or pretreated with anti-TLR2 and anti-TLR4 monoclonal antibodies. Equal amounts of proteins were loaded.
B: Column diagrams and bars represent mean±SEM for the scanned immunoblots (the ratio of TLRs to GAPDH. The results are representative
of three independent experiments. In the image, 10-Hy indicates 10 μg/ml hydrocortisone. The asterisk represents a p value
of <0.05, versus untreated HCFs.
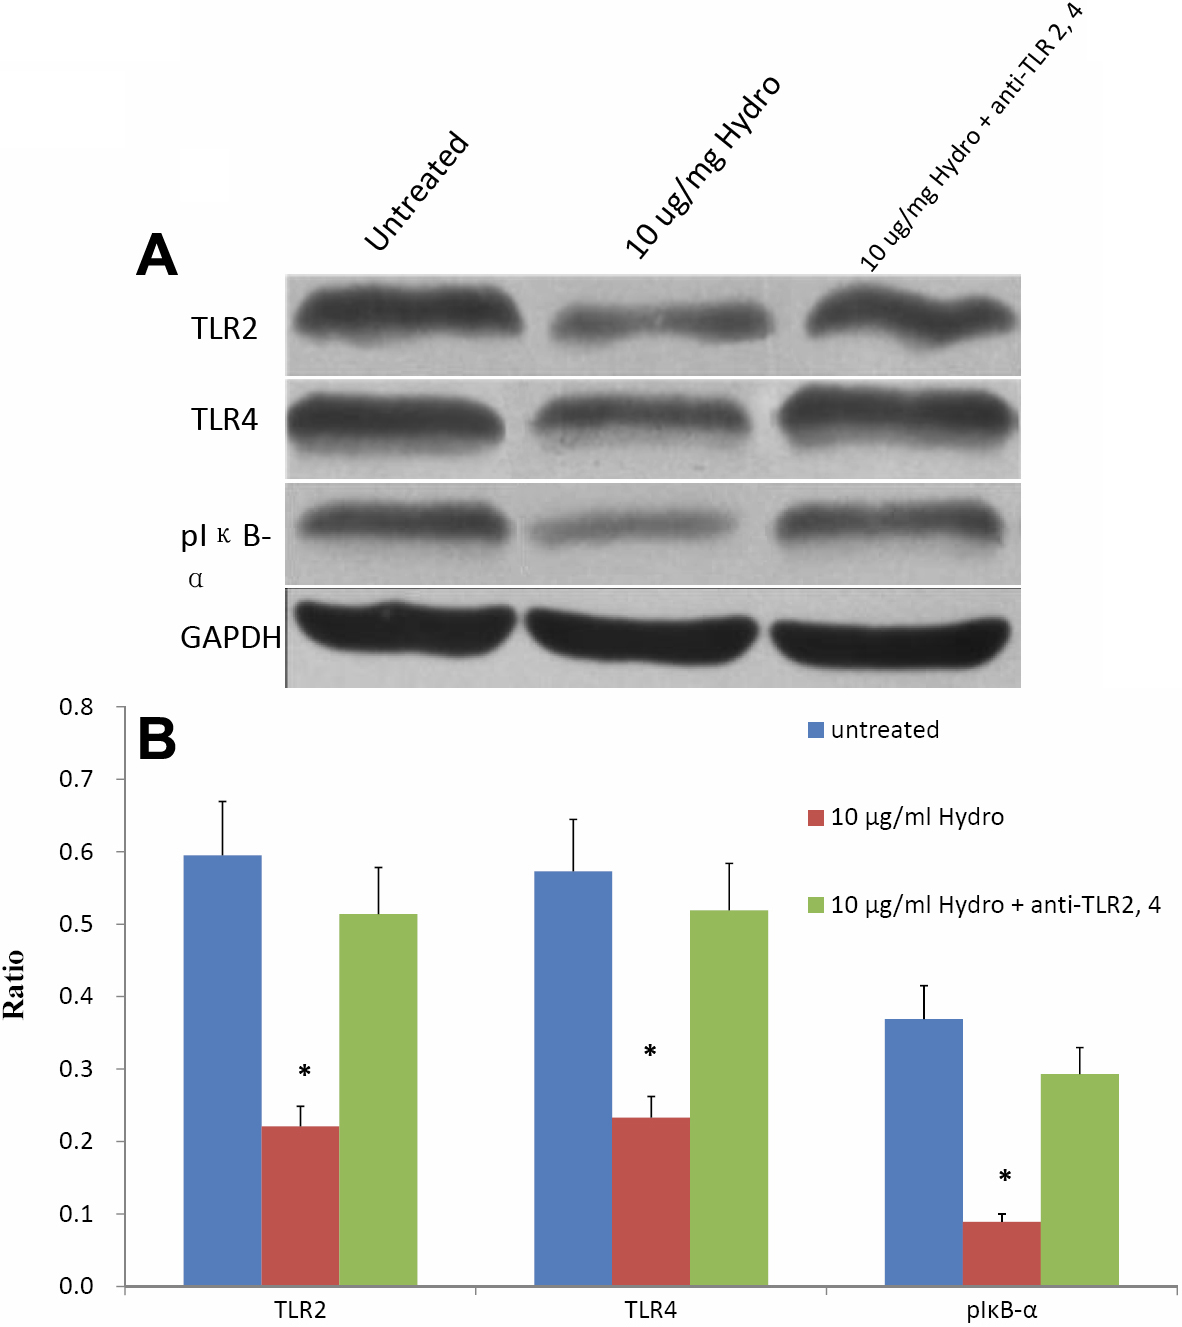
 Figure 4 of
Jin, Mol Vis 2009; 15:2435-2441.
Figure 4 of
Jin, Mol Vis 2009; 15:2435-2441.