Figure 1. TLR2 and TLR4 mRNA expression in hydrocortisone-treated HCF. TLR2 and TLR4 mRNA expression in three concentrations of hydrocortisone-treated HCFs, compared with untreated HCFs. Bars represent mean±SEM
of 3 independent experiments. The asterisk represents a p value of <0.05, versus the control.
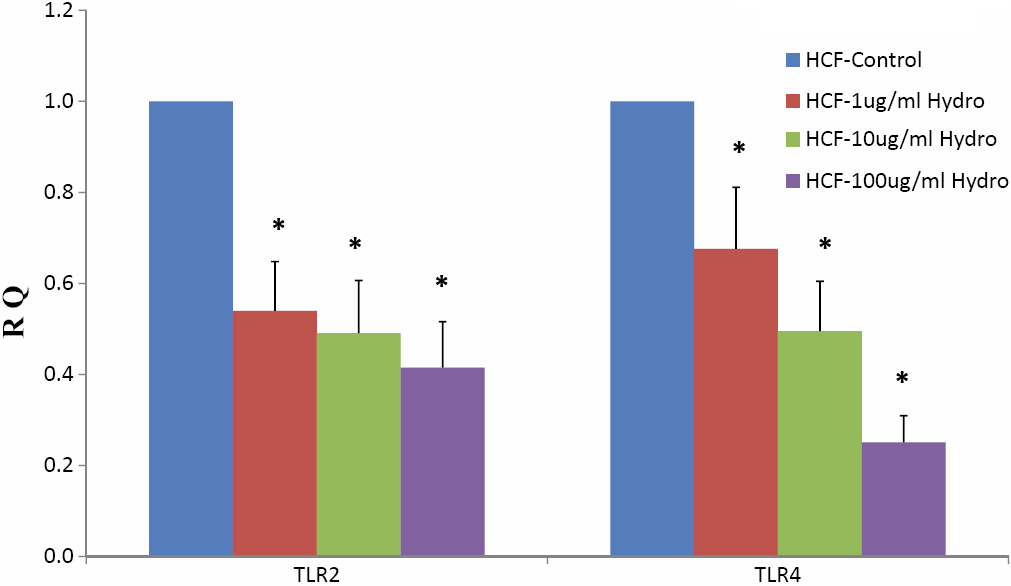
 Figure 1 of
Jin, Mol Vis 2009; 15:2435-2441.
Figure 1 of
Jin, Mol Vis 2009; 15:2435-2441.