Figure 4. Network of abundant genes in the pterygium cDNA library is dominated by functional associations with cell migration processes.
Genes represented by three or more transcripts in the pterygium cDNA library were analyzed by Ingenuity Pathway Analysis.
Each gene (node) is represented by a circle and labeled with its official gene symbol. Direct and indirect relationships are
indicated by solid and dotted lines, respectively. Arrows indicate the direction of intermolecular action. Genes associated
with cell migration are shown in color.
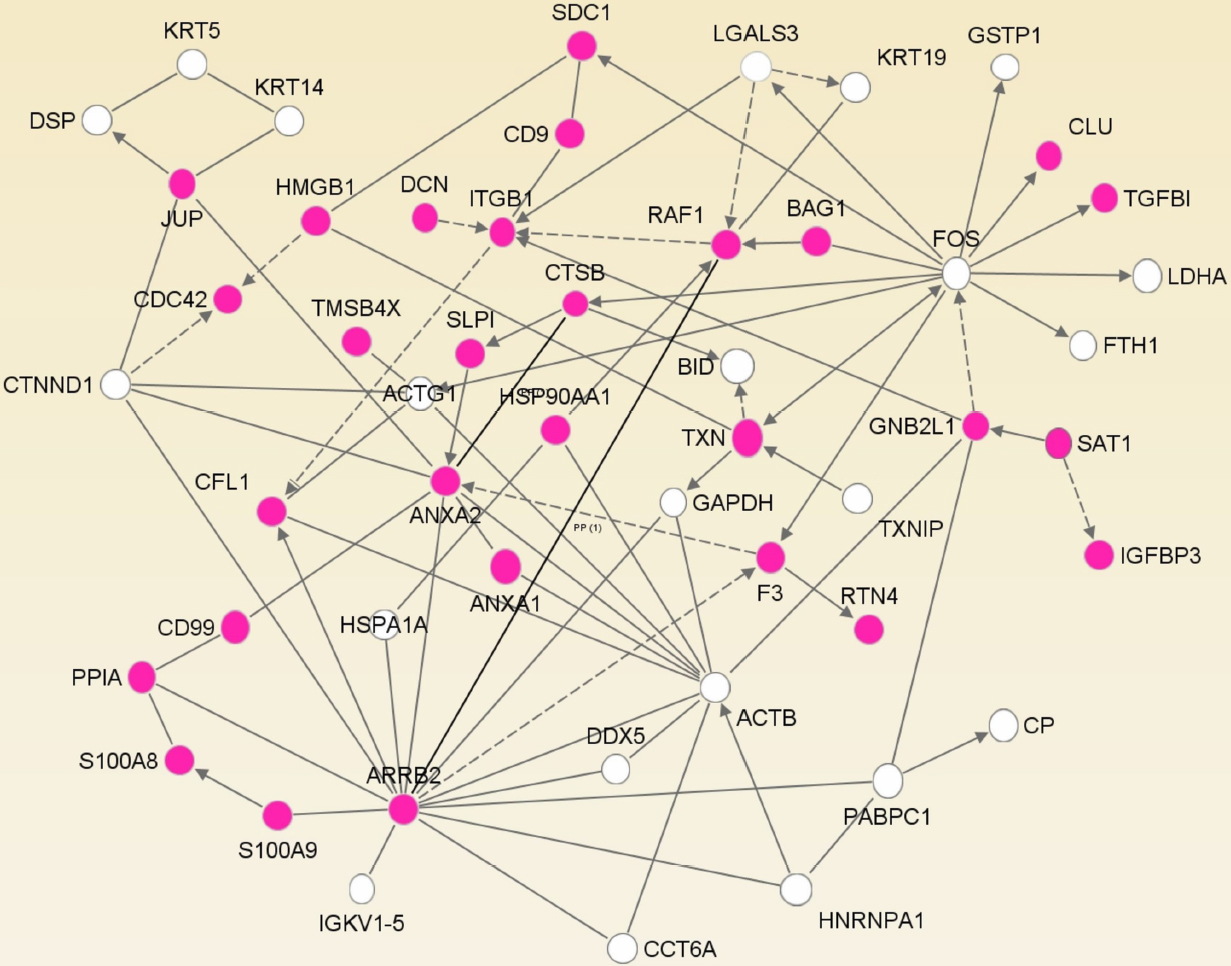
 Figure 4 of
Jaworski, Mol Vis 2009; 15:2421-2434.
Figure 4 of
Jaworski, Mol Vis 2009; 15:2421-2434.