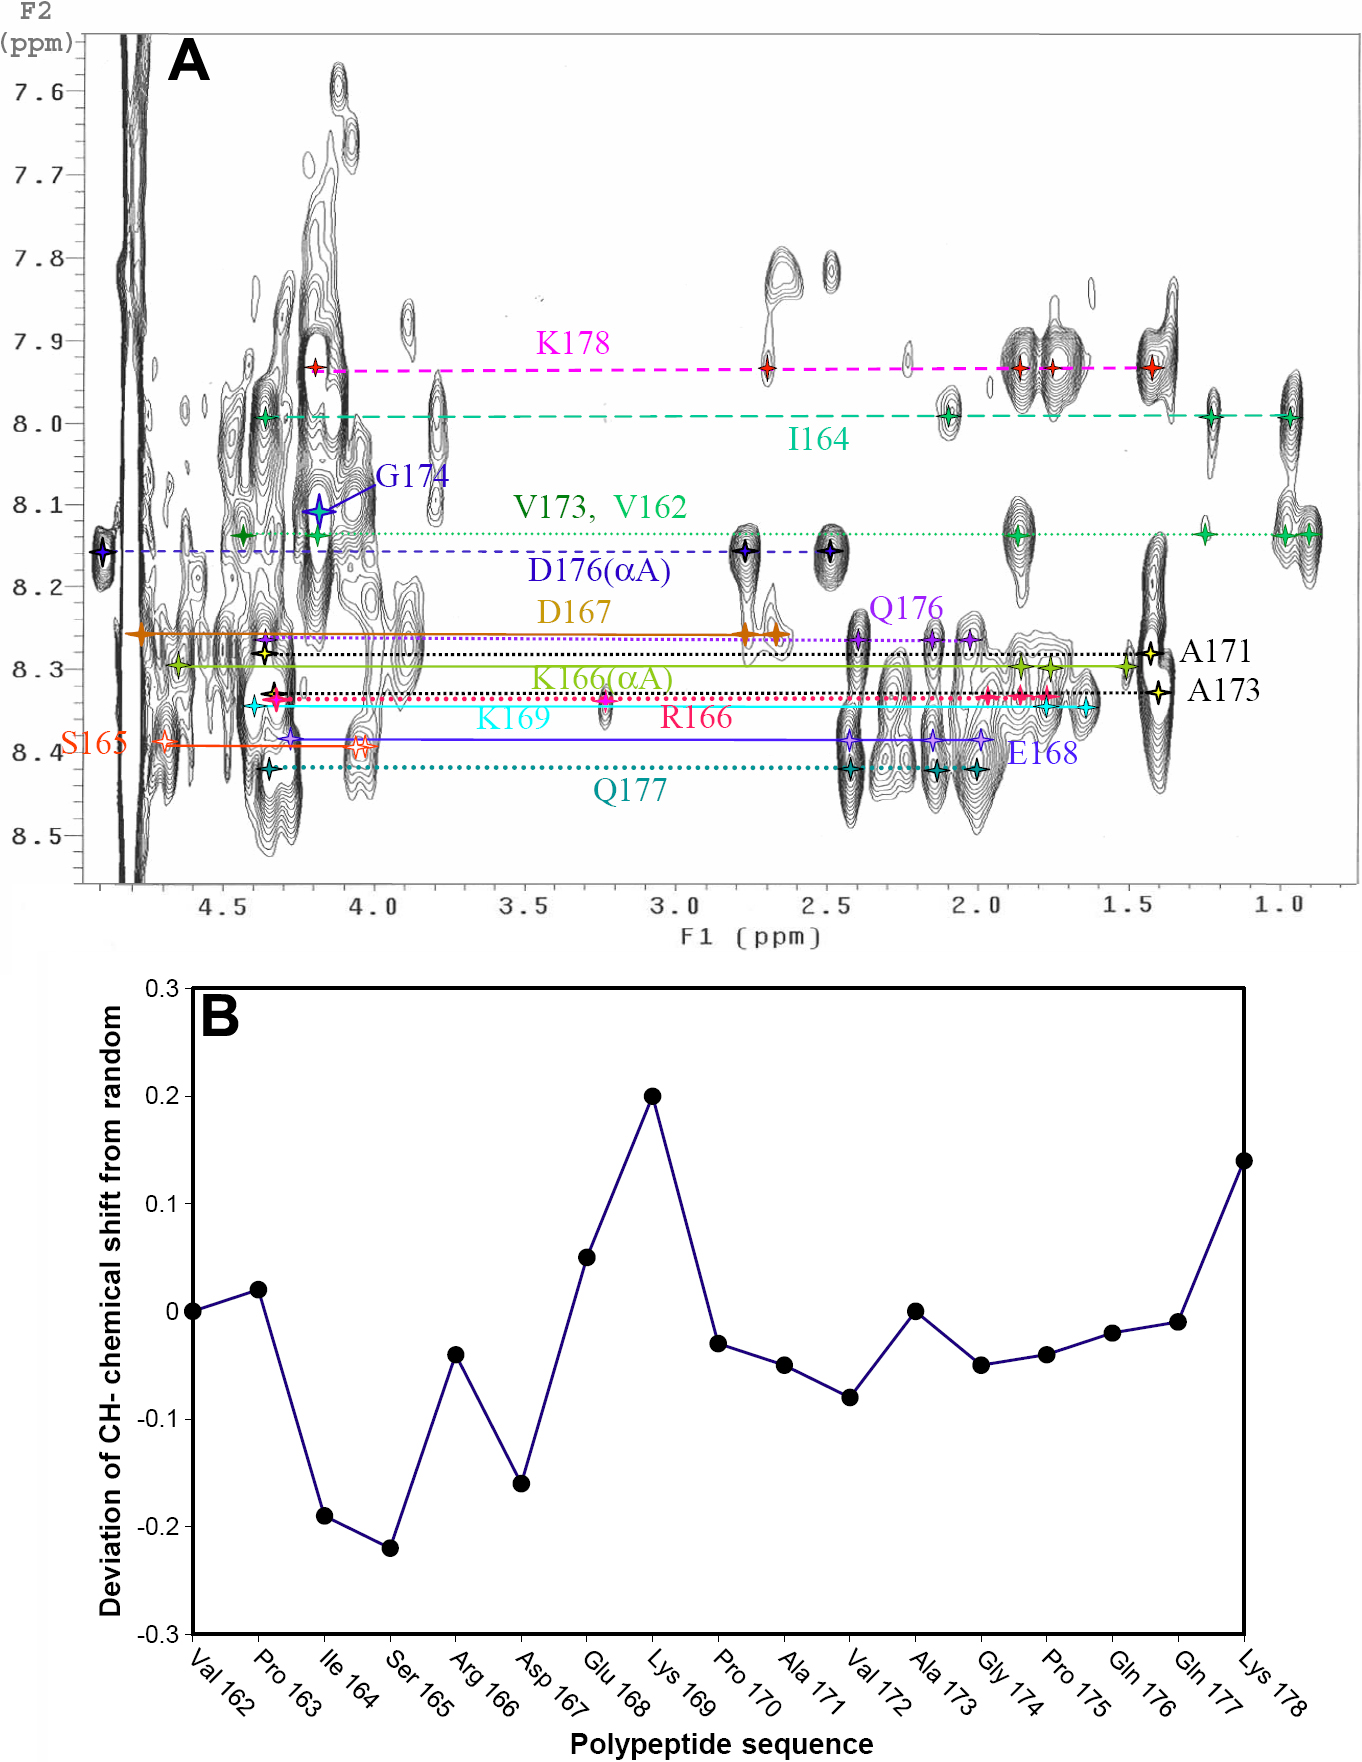
Figure 6. Two-dimensional TOCSY spectrum of dogfish a-crystallin.
A: The NH to α, β and γ
1H proton region of the TOCSY spectrum of dogfish α-crystallin at 25 °C. The assignments are indicated for the αB subunit.
B: Deviation from random coil chemical shifts [
26] for the α-CH
1H resonances of the COOH-terminal extension of dogfish α-crystallin.
 Figure 6 of
Ghahghaei, Mol Vis 2009; 15:2411-2420.
Figure 6 of
Ghahghaei, Mol Vis 2009; 15:2411-2420.