Figure 9. Mel1a and Mel1c
immunocytochemistry of whole-mounted Xenopus laevis surface
corneal epithelium obtained at 4-h intervals during a 24-h light–dark
cycle. Frogs were housed under a 12 h:12 h light–dark cycle (6:00 AM:
lights on; 6:00 PM: lights off). All tissues in this figure were
obtained in the light. Mel1c labeling is represented in green (A,
D, and G) and Mel1a labeling is represented in red (B,
E, and H). The yellow labeling in the merged images (C,
F, and I) indicates regions of co-localization of the
red and green signal. A-C: Corneas obtained at 8:00 AM (2 h
after lights on). Mel1c and Mel1a labeling is localized to the lateral
plasma membrane of different yet overlapping subpopulations of cells. D-F:
Corneas obtained at 12:00 N (mid-light). Mel1a and Mel1c immunolabeling
is present on the lateral membranes of different populations of CE
cells, with some minor regions of overlap. G-I: Corneas
obtained at 4:00 PM (2 h before lights off). Most of the Mel1a and
Mel1c immunolabeling is co-localized on the lateral membranes, with
some cytoplasmic labeling that is not co-localized. Nuclei are stained
with DAPI. The confocal images in all panels are comprised of three
optical slices of 400 nm each in the z-series. The magnification bar (I)
represents 20 µm.
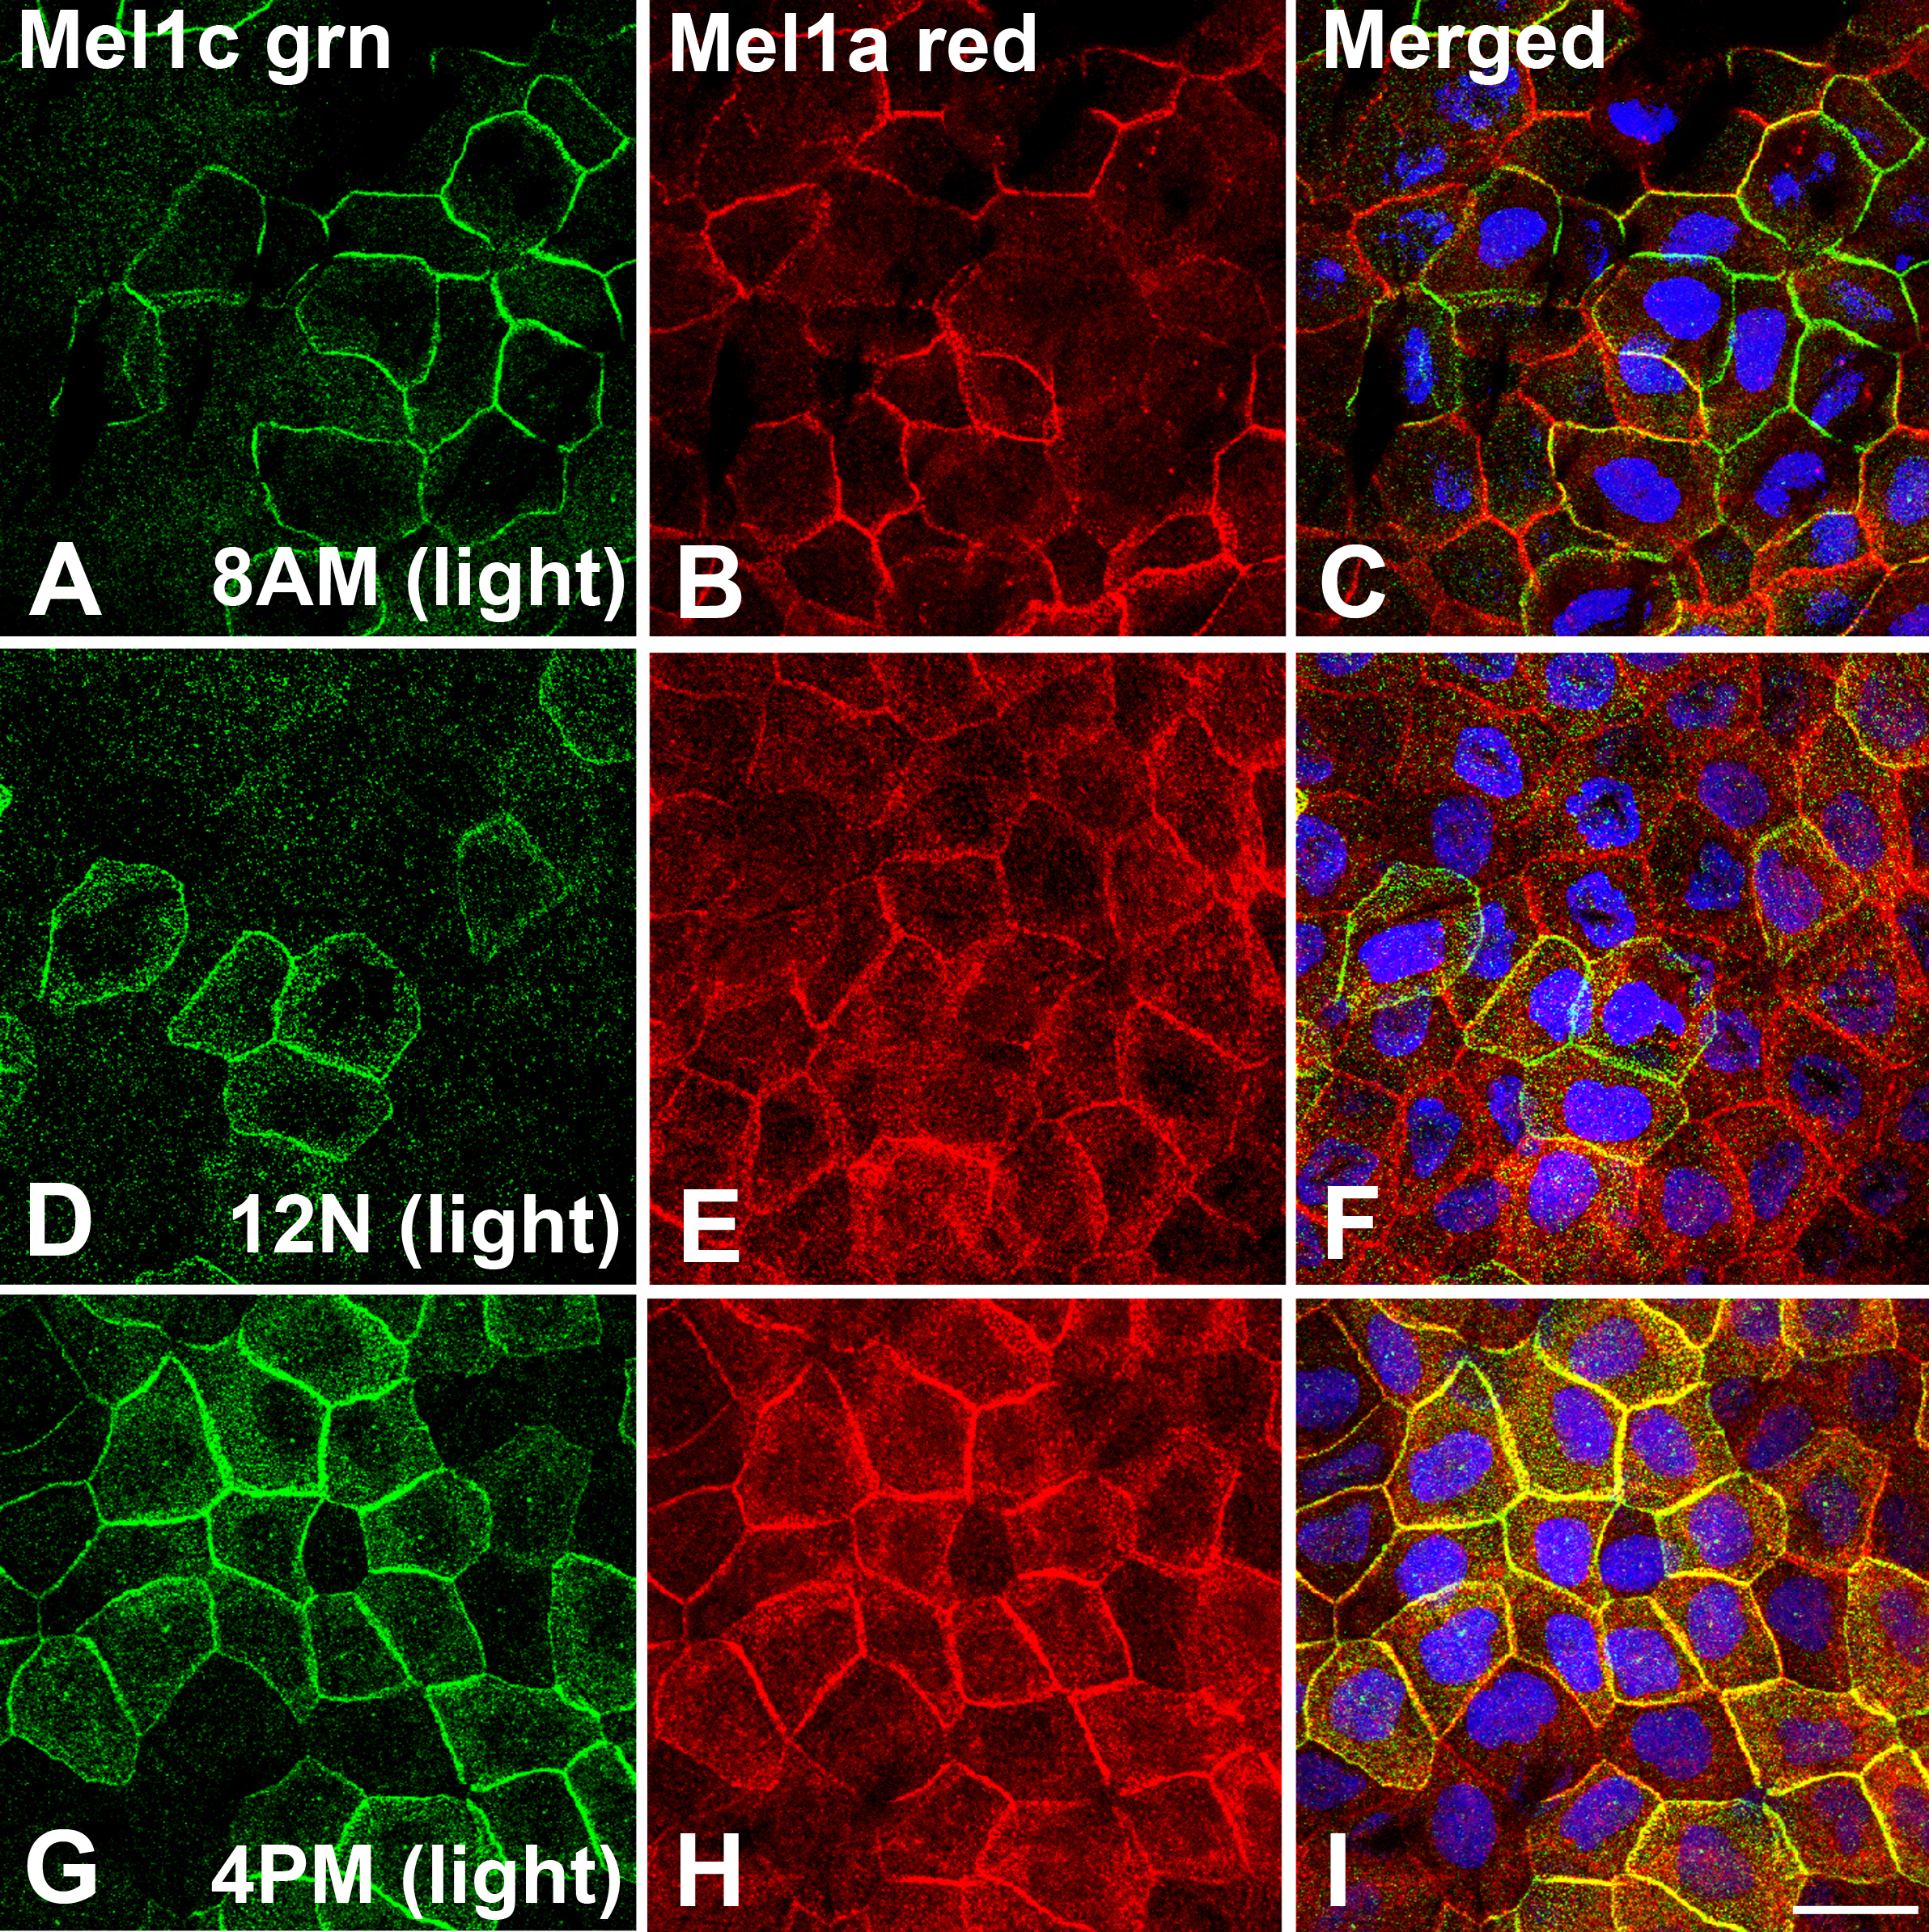
 Figure 9 of Wiechmann, Mol Vis 2009; 15:2384-2403.