Figure 11. Confocal analysis of Mel1a and
Mel1c immunocytochemistry of whole-mounted Xenopus laevis
surface corneal epithelium at two separate time points.
Three-dimensional reconstructions of confocal z-stacks of optical
slices of the 8:00 AM (A, C, and E) and 4:00 PM (B,
D, and F) specimens were rotated at 63° on the x-axis to
enable optimal viewing of the pattern of immunolabeling. At 8:00 AM (A,
C, and E), areas of lateral membranes express only the
red Mel1a receptor label (large arrow) or the green Mel1c receptor
label (large arrowhead). In some areas of merged Mel1a-Mel1c
co-localization, only the yellow color is observed (small arrow),
indicating receptor co-localization. There are also areas of membrane
that express the yellow co-localization but have small areas of red
Mel1a or green Mel1c label interdigitated with the yellow label
(asterisks). At 4:00 PM (B, D, and F), the
lateral membranes show a more uniform pattern of immunolabeling than
observed at the 8:00 AM time point. The yellow co-localization label is
predominant in the most apical portion of the membranes, but in the
more basal area of the lateral membranes distinct punctate red Mel1a
and green Mel1c labeling is also observed. Nuclei are stained with
DAPI. The confocal images in panels A and E are
comprised of 16 optical slices of 400 nm each in the z-series. The
confocal images in panels B and F are comprised of 16
optical slices of 400 nm each in the z-series. The images in panels C
and D are comprised of a single optical slice of 400 nm. The
magnification bar (F) represents 20 µm.
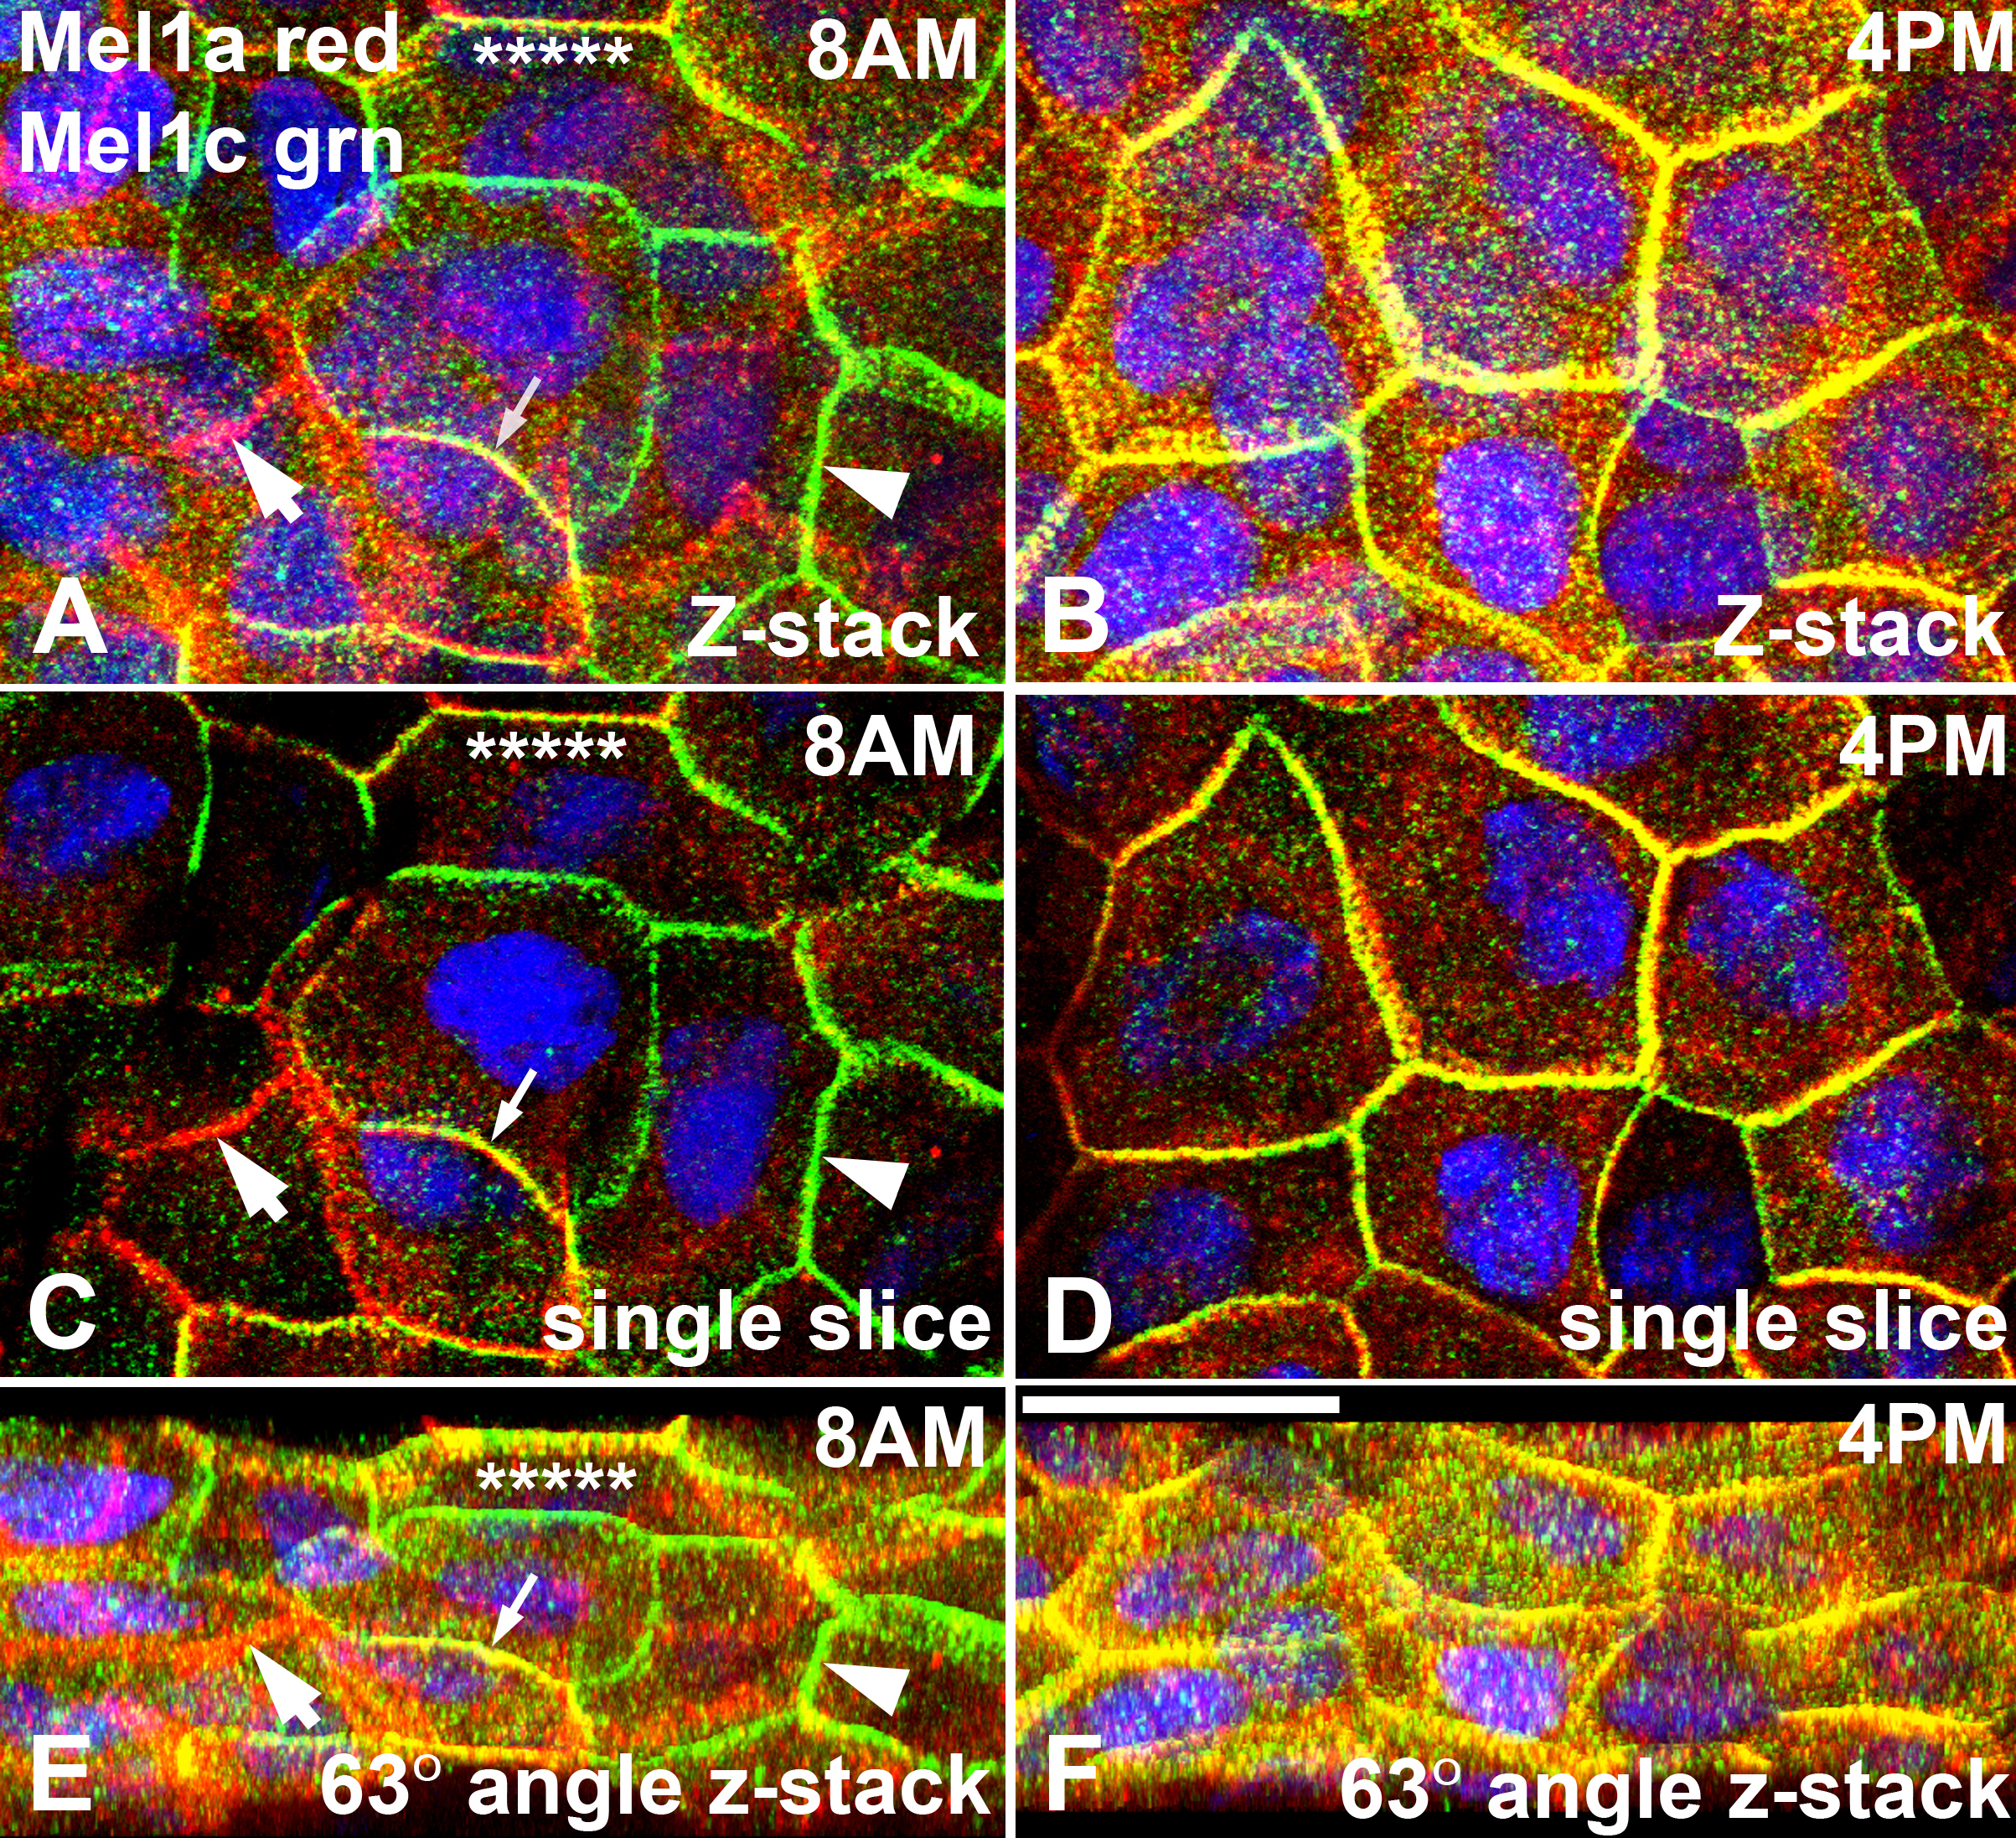
 Figure 11 of Wiechmann, Mol Vis 2009; 15:2384-2403.