Figure 9. Evolution of
electroretinographic wave amplitudes over a 12-week time period.
Average data (mean±SEM) of the reduction in the ERG wave amplitudes is
represented as the percentage between operated and unoperated eyes for
1, 2, 4, and 12 weeks after ONT, both from albino (A, C)
and pigmented rats (B, D). A, B: Close
triangles show averaged amplitudes for the positive scotopic threshold
response (pSTR) and open triangles show averaged amplitudes for the
negative scotopic threshold responses (nSTR). C, D:
Open circles show averaged data for the a-wave amplitudes and closed
circles show averaged data for the b-wave amplitude. A permanent
reduction in the pSTR and nSTR was observed for the 12-week time period
both for pigmented and albino rats. The reduction in the a-wave and
b-wave amplitudes recovered earlier in albino rats than in pigmented
rats.
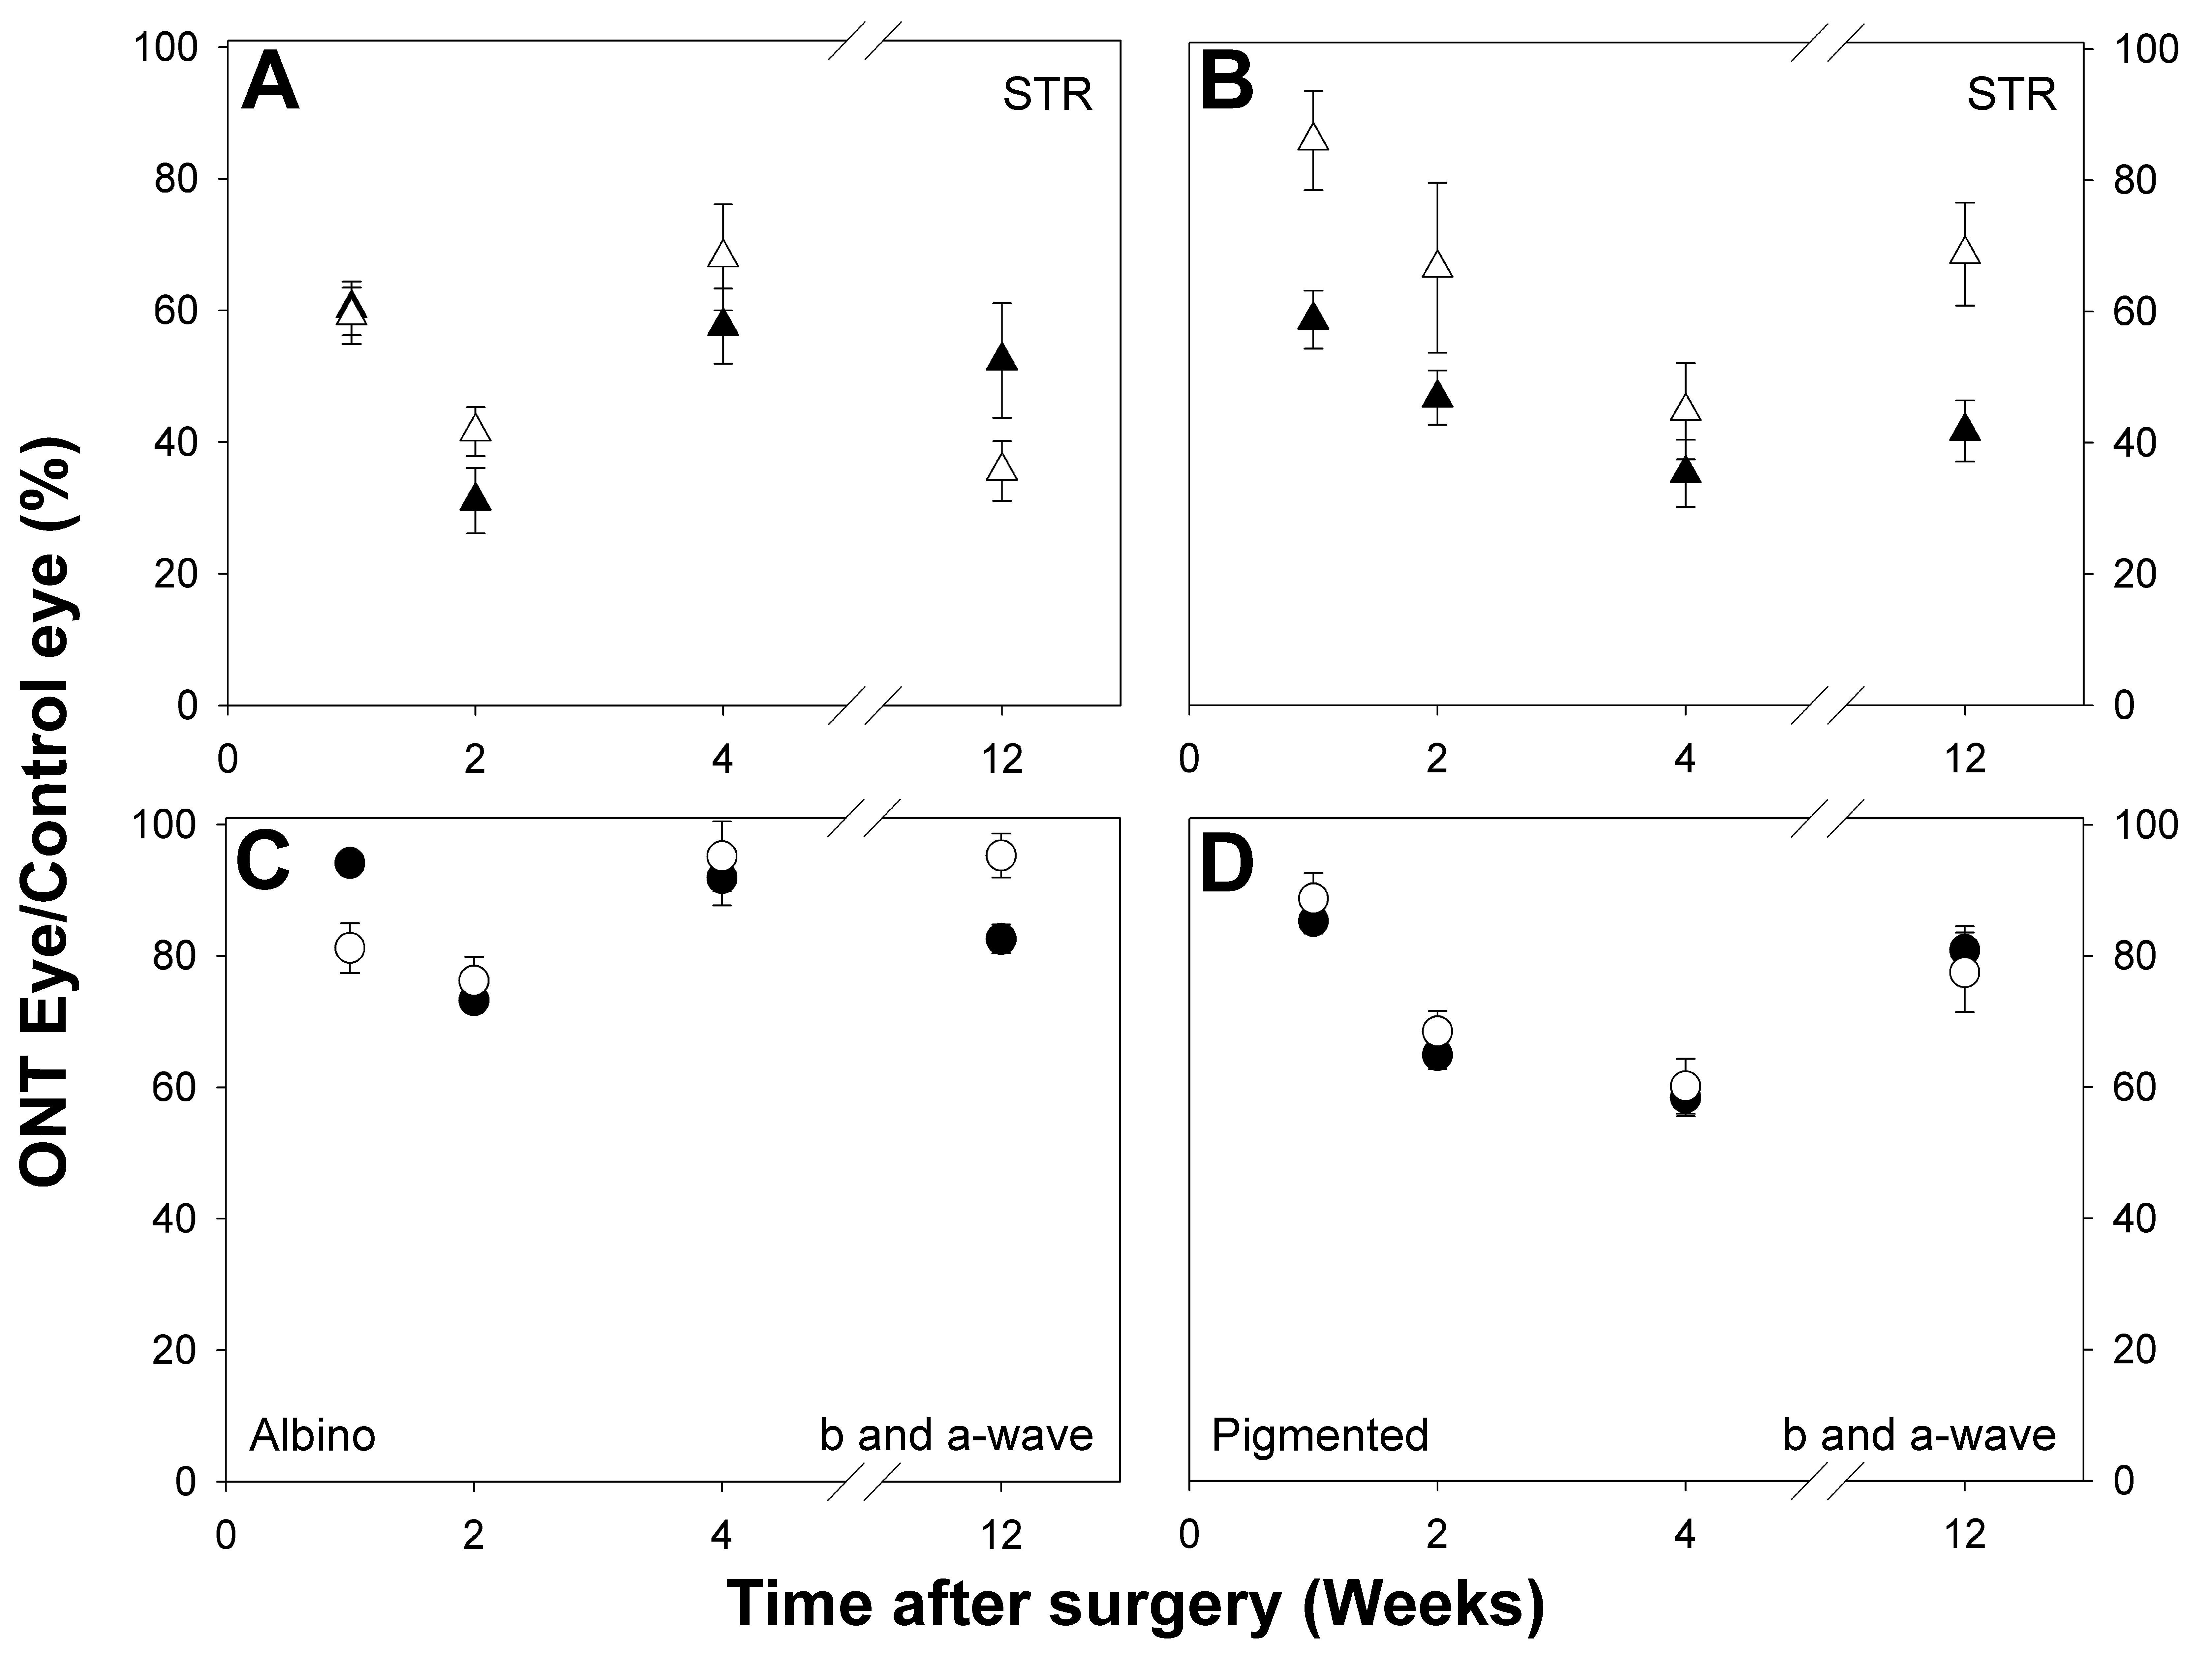
 Figure 9 of Alarcón-Martínez, Mol Vis 2009; 15:2373-2383.