Figure 8. Electroretinographic amplitude
measurements 12 weeks after optic nerve transection. Averaged data
(mean±SEM) of
ERG amplitudes versus stimulus intensity both from albino (A, C;
n=9)
and pigmented rats (B, D; n=5) from recordings
obtained twelve weeks after ONT. Open symbols show data averaged from
unoperated right eyes and filled symbols show data averaged from
operated left eyes. A, B: Data corresponding to
positive scotopic threshold responses (pSTR) are shown as circles and
that corresponding to negative scotopic threshold responses (nSTR) are
shown as triangles. C, D: Amplitudes corresponding to
the a-wave are shown as triangles and those corresponding to b-wave are
shown as circles. A significant reduction of ERG wave amplitudes in
operated eyes versus unoperated eyes is observed for the pSTR and nSTR
responses (p<0.001) in both strains of rat. There was a small
reduction in the b-wave scotopic response and a- and b-wave of the
mixed response in pigmented rats (p<0.001).
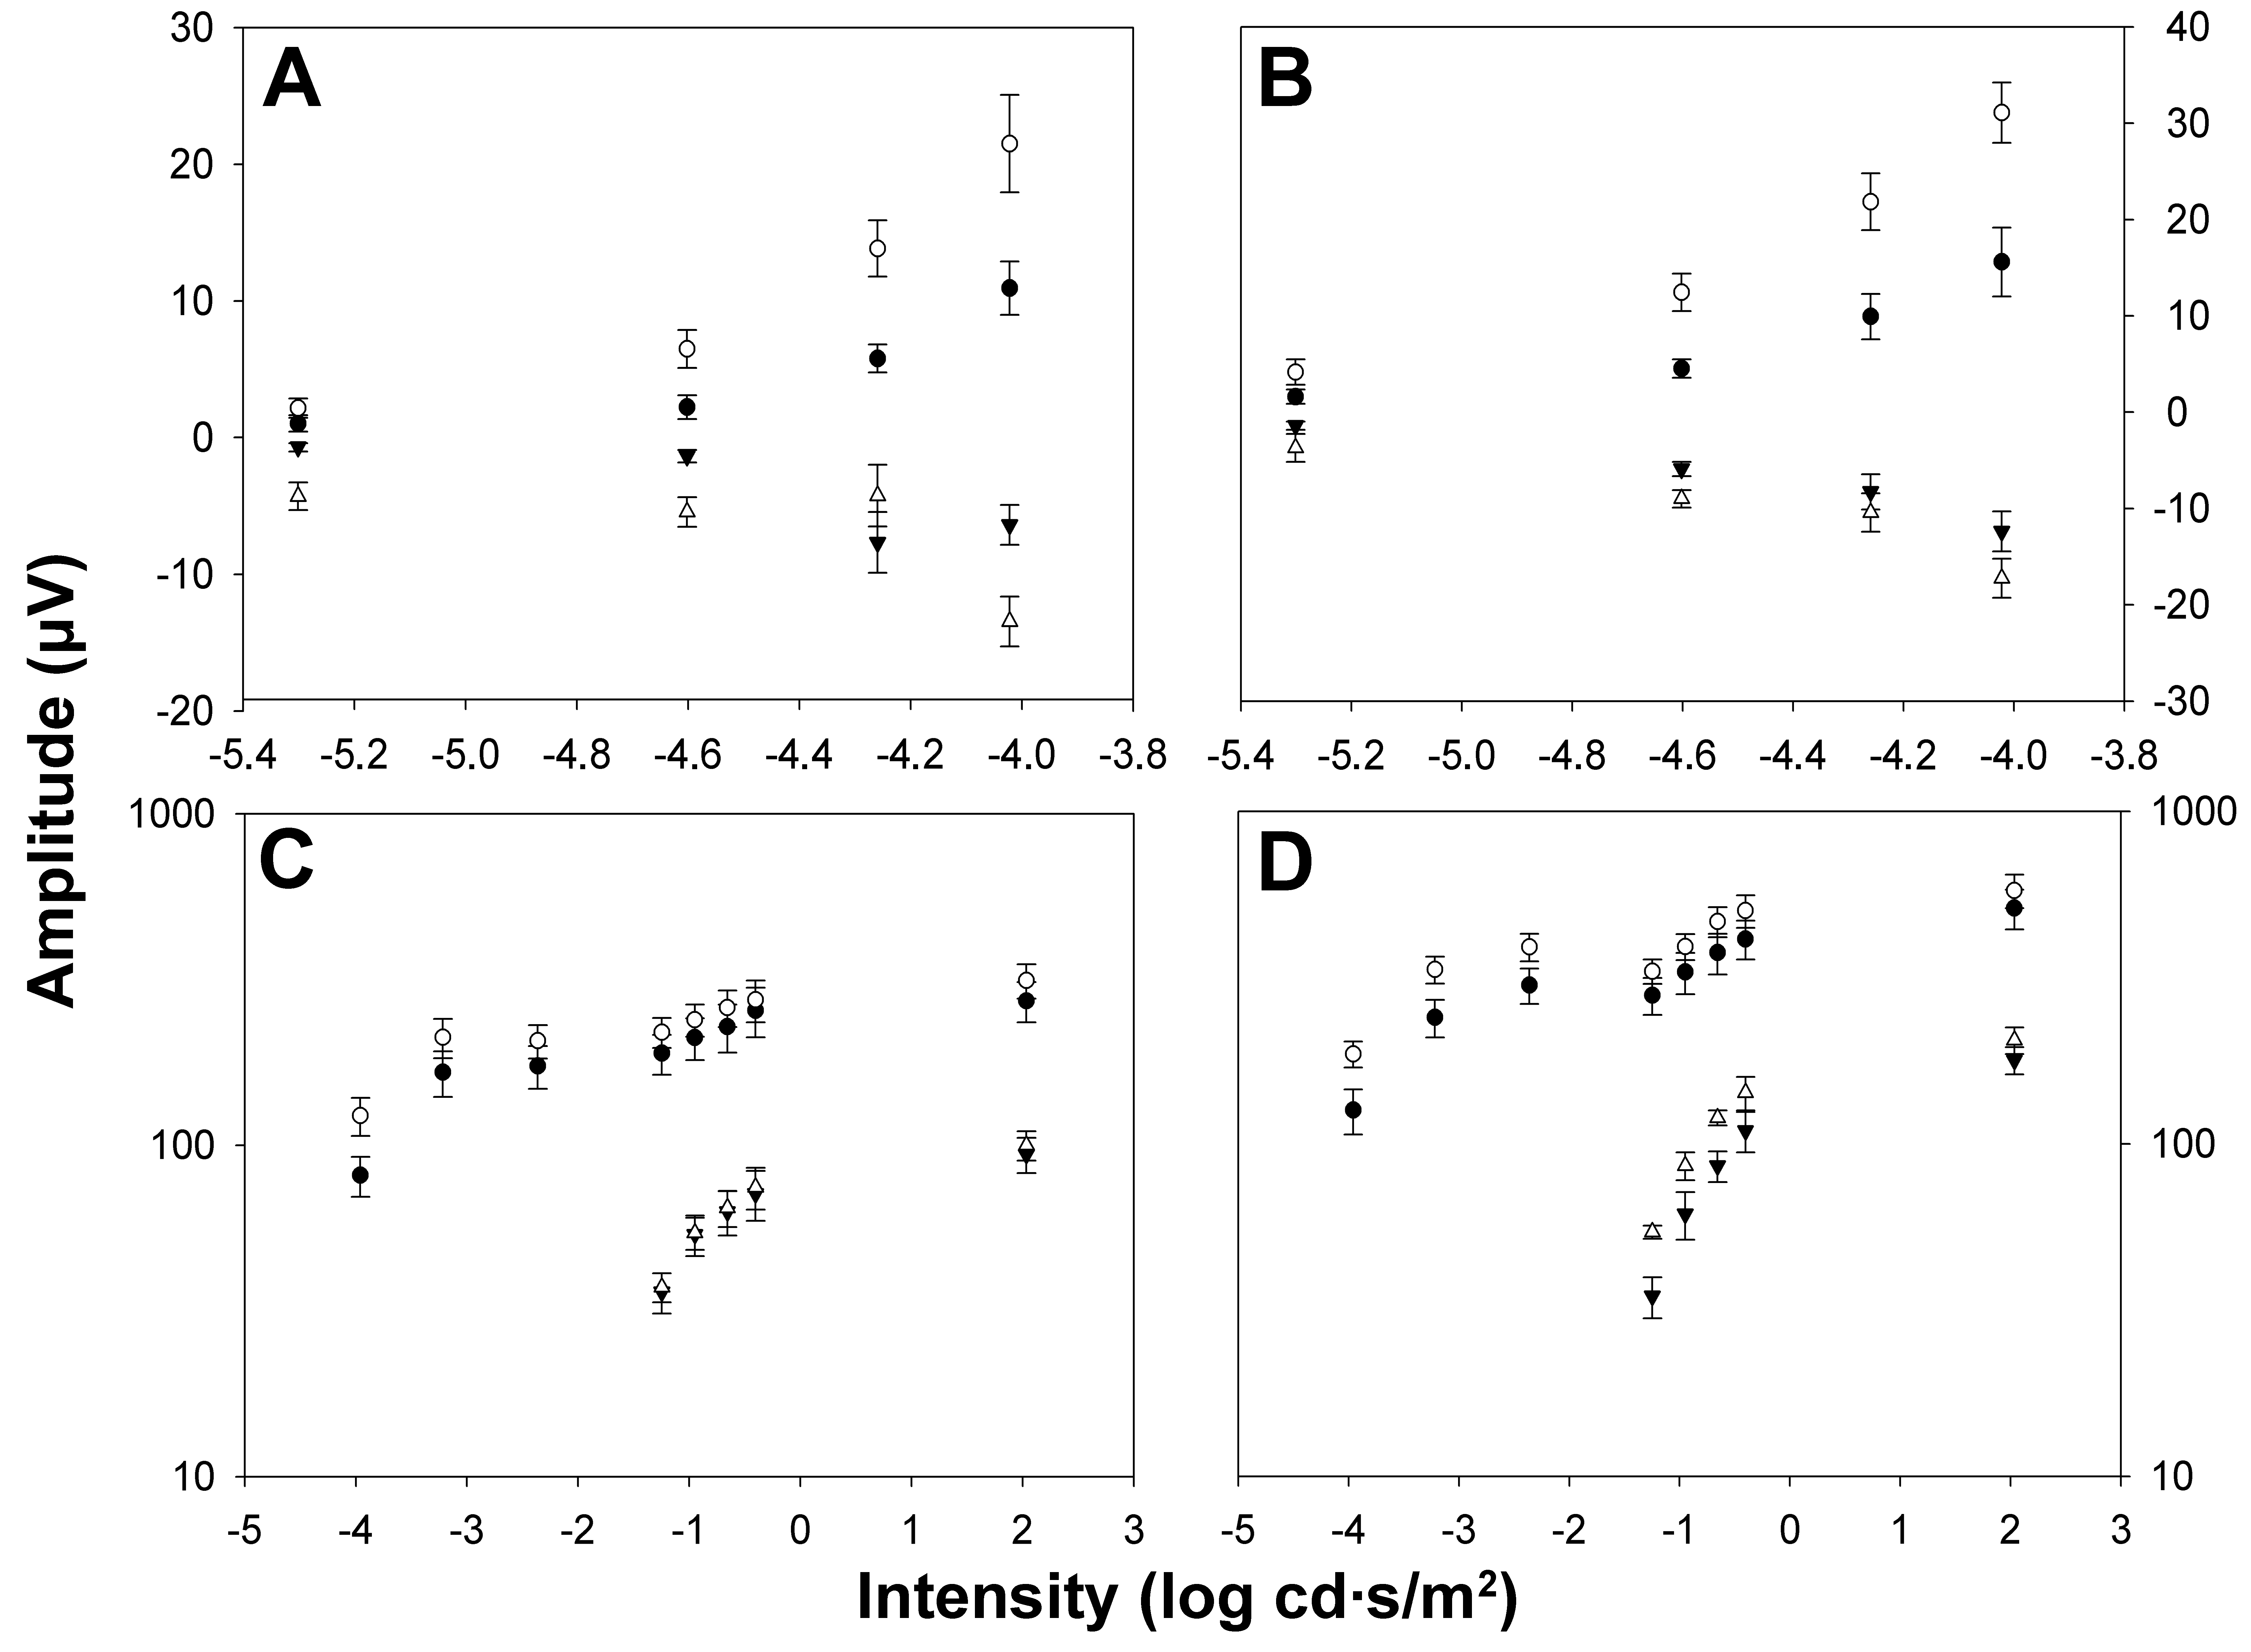
 Figure 8 of Alarcón-Martínez, Mol Vis 2009; 15:2373-2383.