Figure 7. Scotopic electroretinographic
recordings 12 weeks after optic nerve transection. Examples of the ERG
traces recorded in an albino (A) and pigmented (B) rats
in response to flash stimuli of increasing intensity for the unoperated
right eye (thin traces) and for the operated left eye (bold traces) 12
weeks after optic nerve transection. The intensity of the flash stimuli
is indicated to the left of the recording traces. Reduction in the pSTR
and nSTR responses from operated eyes versus unoperated eyes was
clearly seen 12 weeks after ONT, while no other apparent difference in
ERG scotopic and mixed responses was evident between the operated and
unoperated animals for both rat strains.
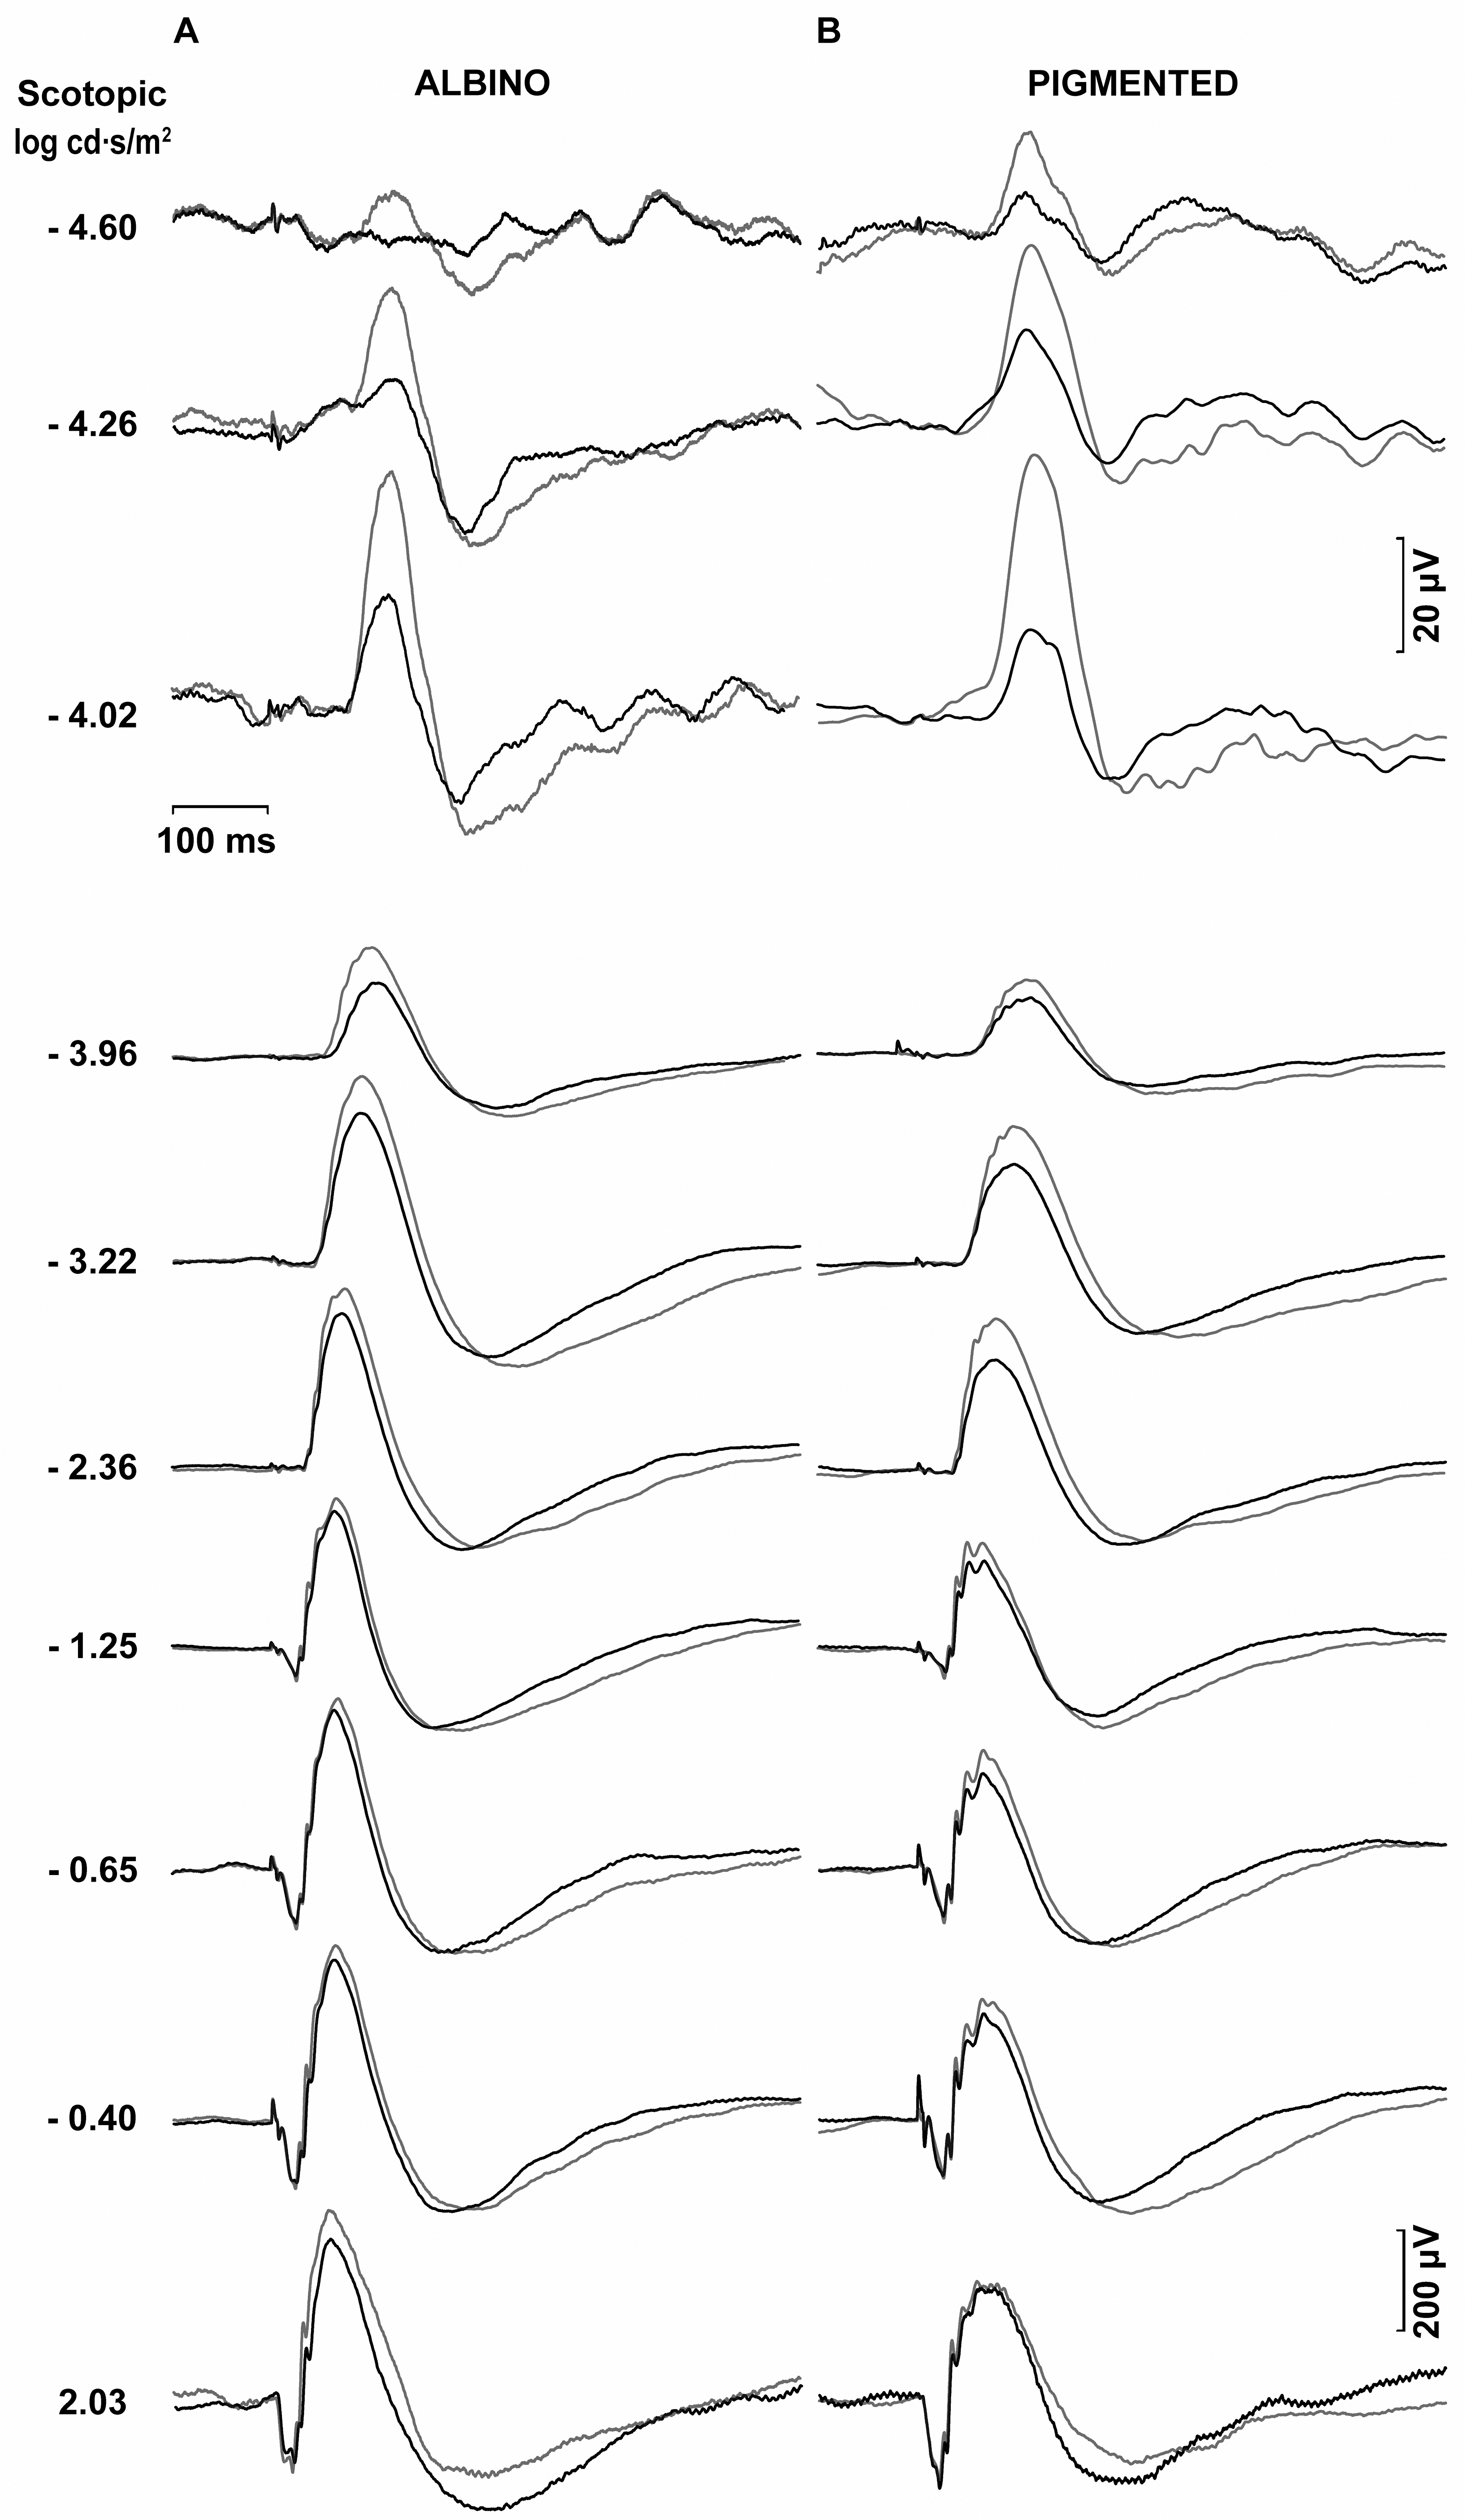
 Figure 7 of Alarcón-Martínez, Mol Vis 2009; 15:2373-2383.