Figure 2. Electroretinographic amplitude
measurements in albino and pigmented rats. Averaged data (mean±SEM) of
ERG amplitudes versus stimulus intensities both from control albino (A,
C; n=6) and pigmented rats (B, D; n=8) is shown
for the right eye (open symbols) and left eye (filled symbols). A, B:
Positive scotopic threshold response (circles) and negative scotopic
threshold responses (triangles). C, D: Triangles
correspond to the a-wave amplitude and circles correspond to the b-wave
amplitudes. When the amplitudes obtained from the albino group were
compared to those of the pigmented, there were no significant
differences (t-test; p>0.05) for any of the waves analyzed,
except the pSTR (t-test; p<0.05).
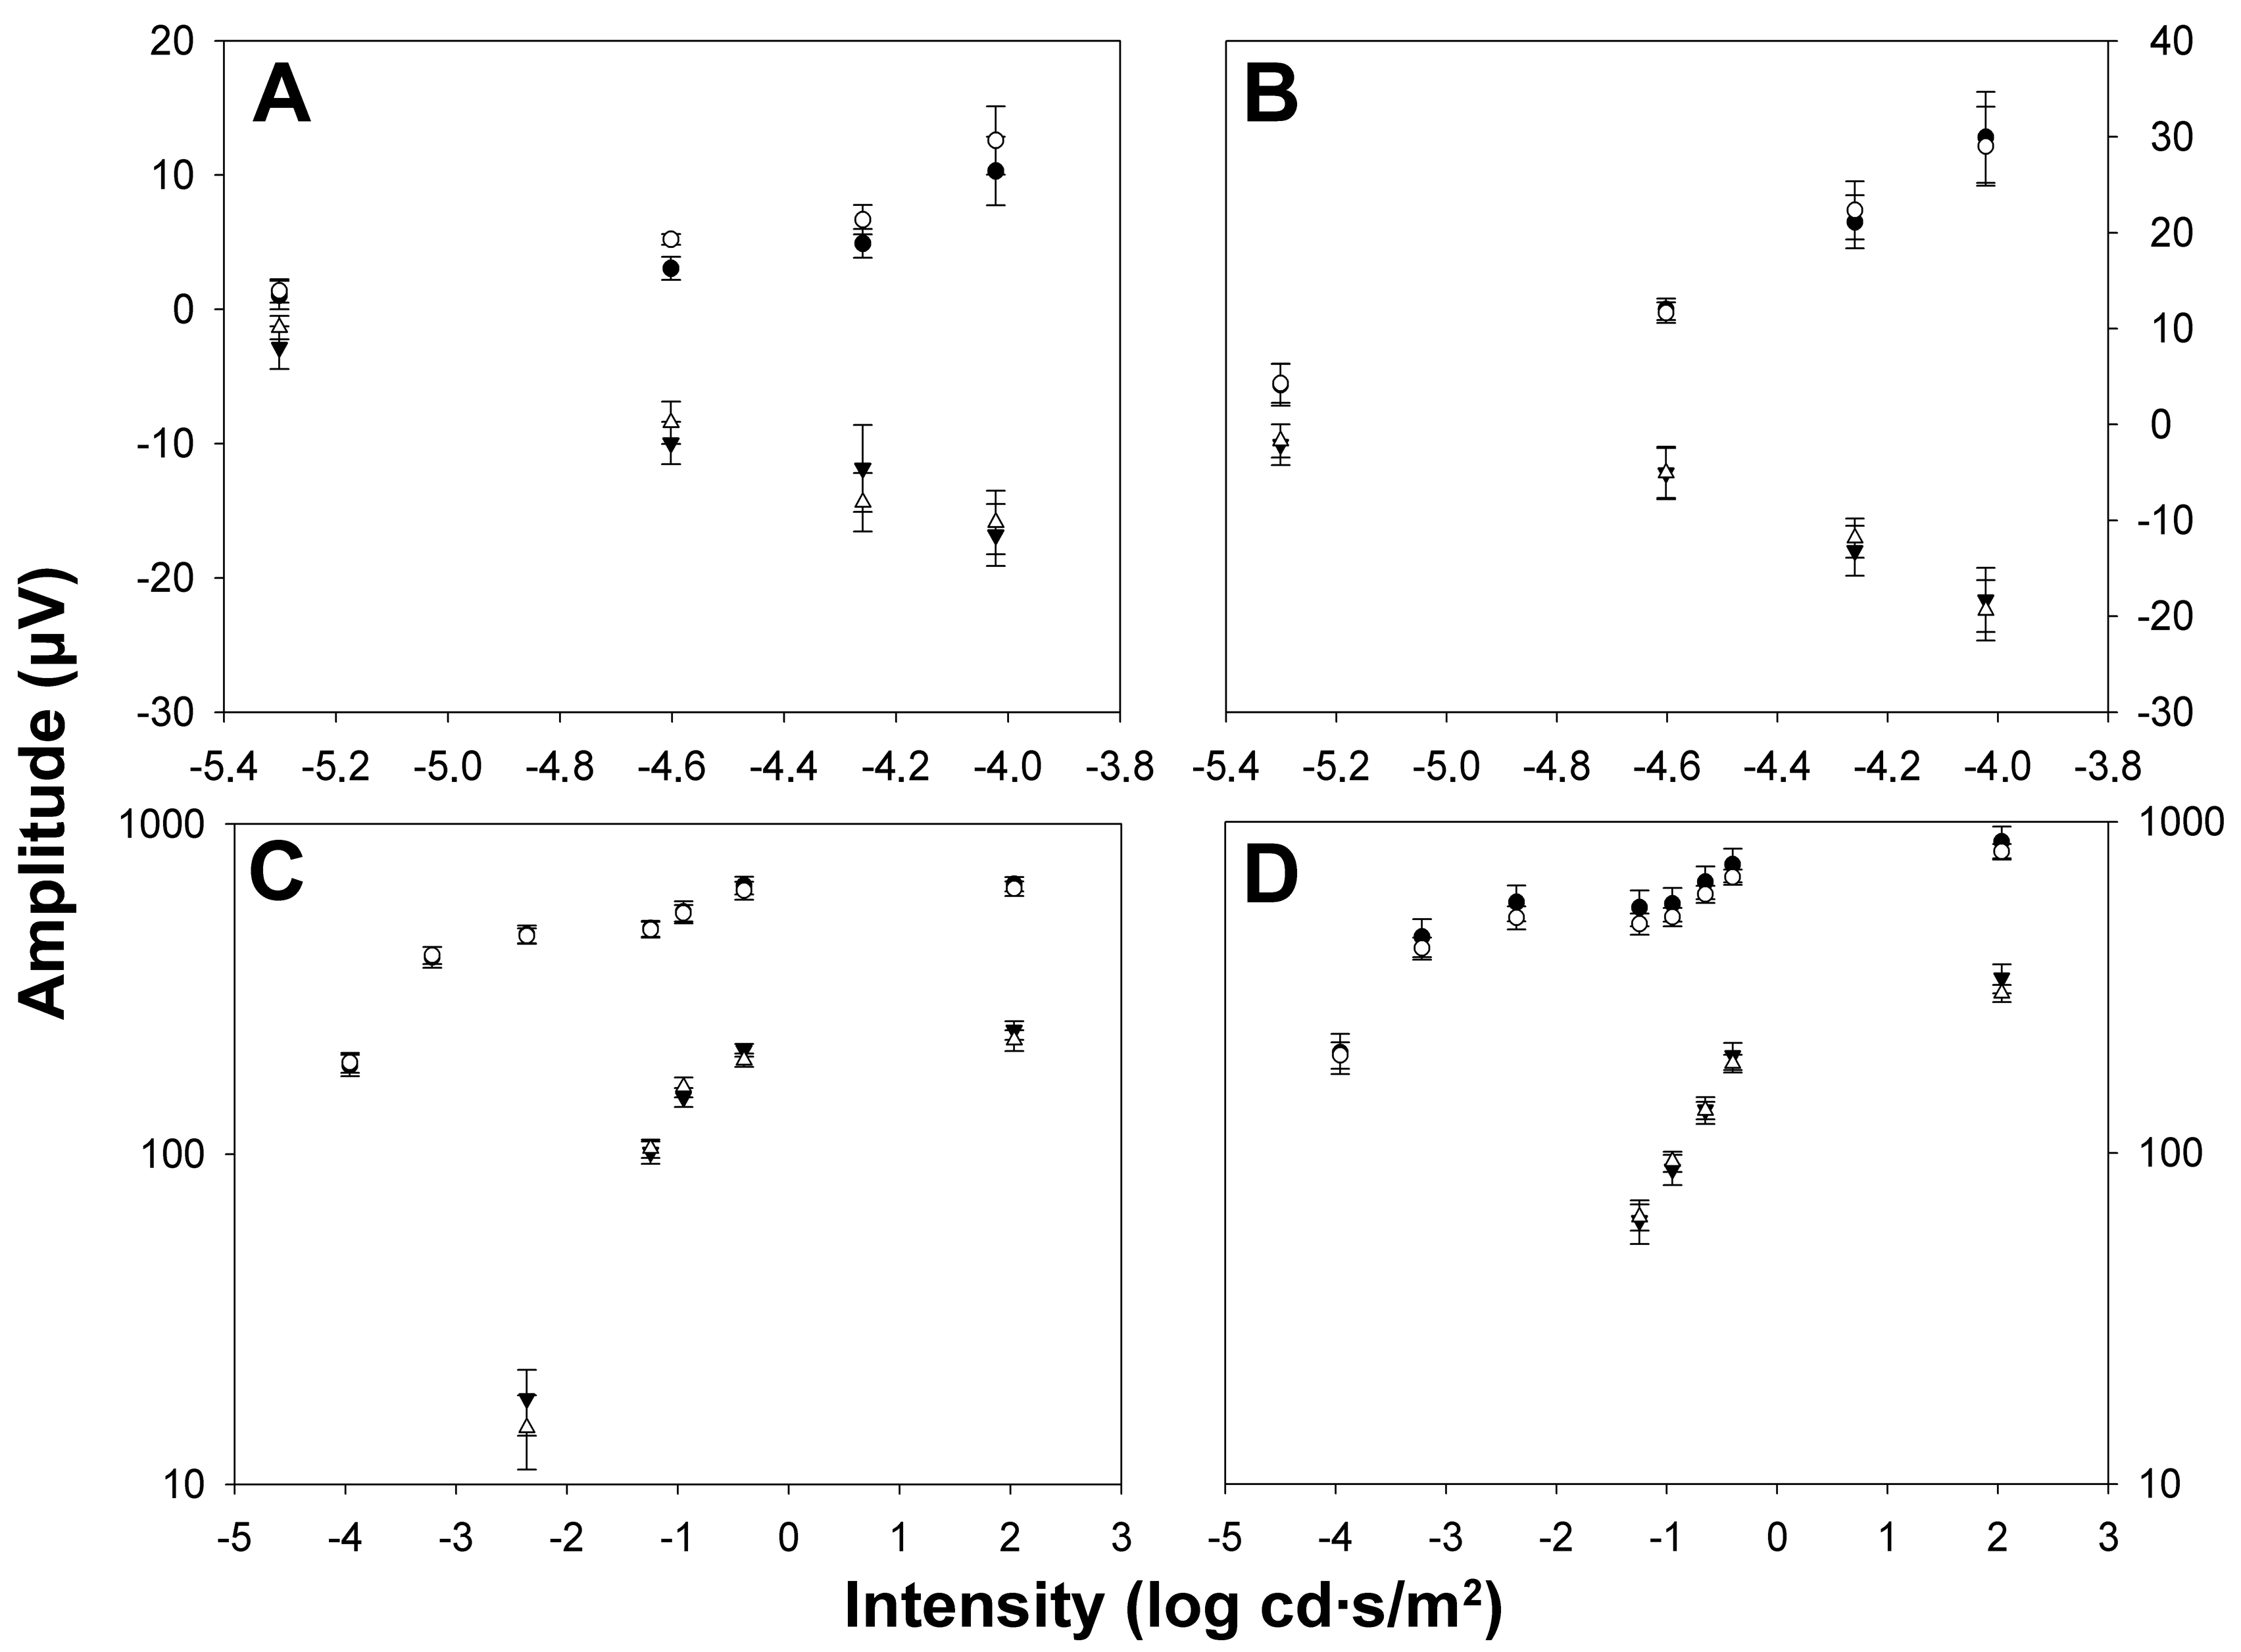
 Figure 2 of Alarcón-Martínez, Mol Vis 2009; 15:2373-2383.