Figure 1. Scotopic electroretinographic
recordings in albino and pigmented rats. Examples of the ERG traces
recorded in an albino (A) and pigmented (B) rats in
response to flash stimuli of increasing intensity. Thin traces
correspond to recordings obtained from the right eye and bold traces
correspond to recordings obtained from the left eye. The intensity of
the flash stimuli is indicated in log cd·s/m2 units at the
left of the recording traces. The scotopic threshold responses were
elicited by weak light stimuli from −4.60 to −5.40 log cd·s/m2.
Rod
and mixed responses were elicited by light intensities from −3.96
to 2.03 log cd·s/m2. No significant difference in the ERG
amplitudes between left and right eyes was observed in any of the
studied animals. Examples for the measurement of wave amplitudes are
shown in the albino rat recordings.
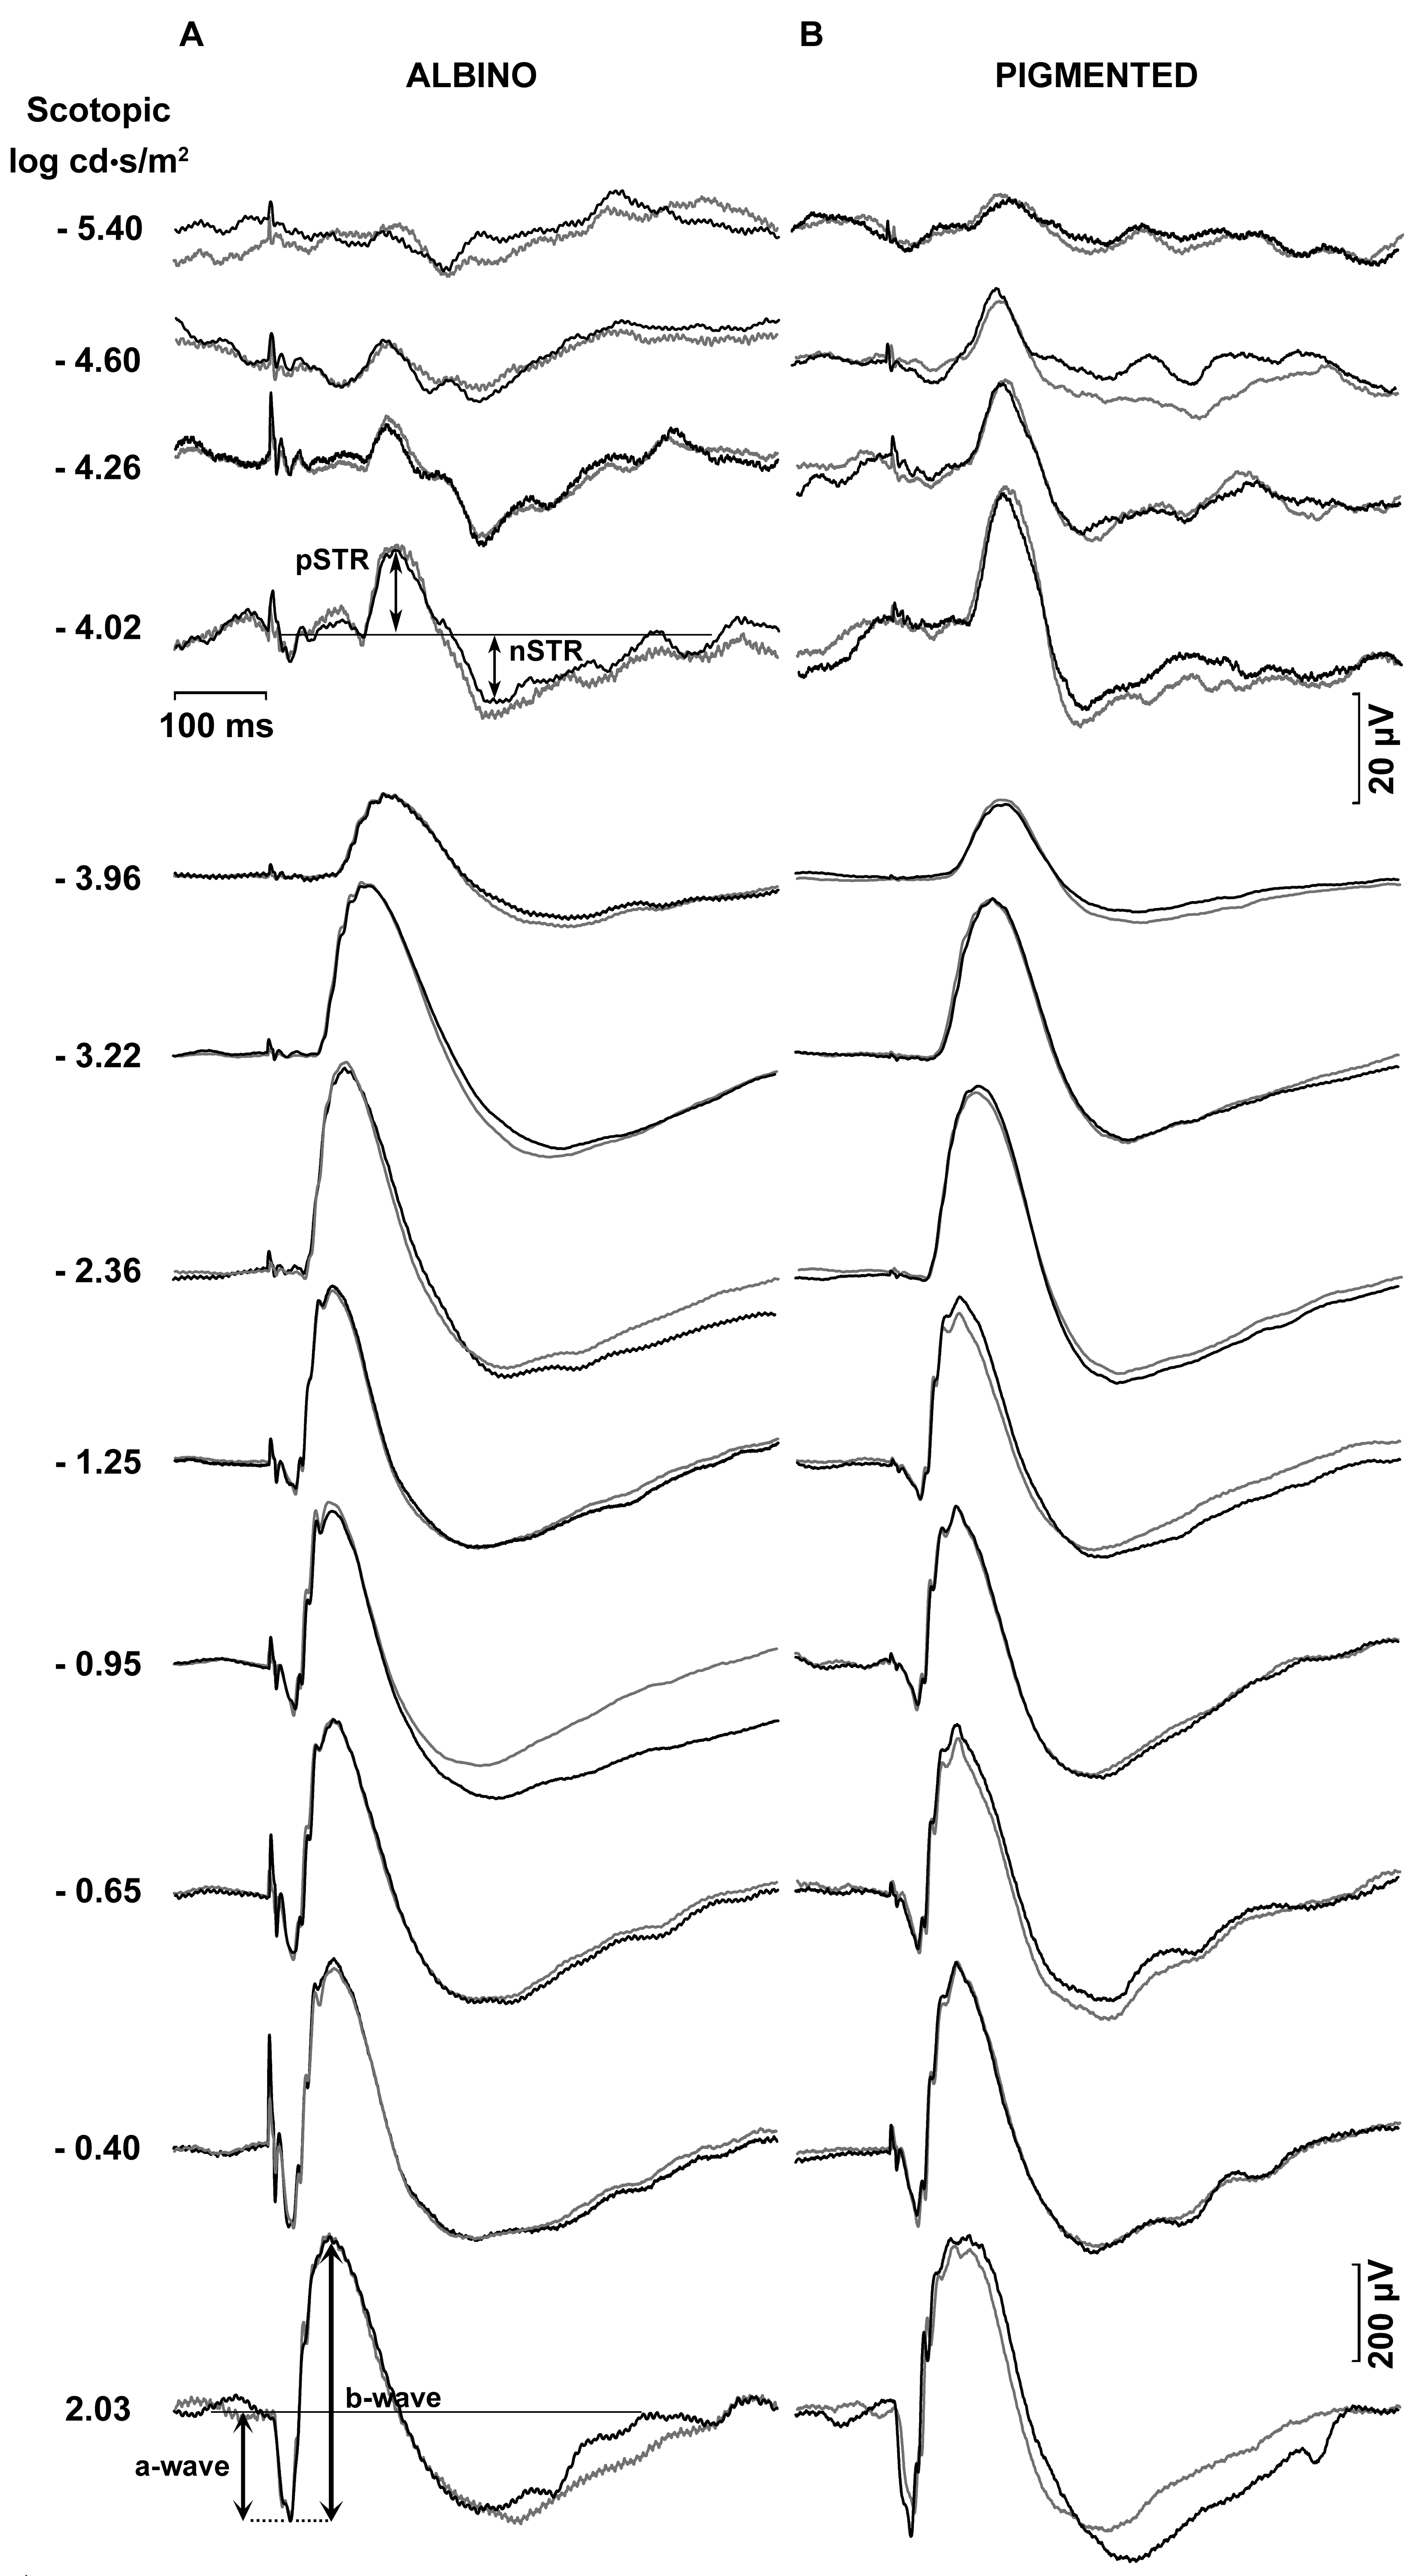
 Figure 1 of Alarcón-Martínez, Mol Vis 2009; 15:2373-2383.