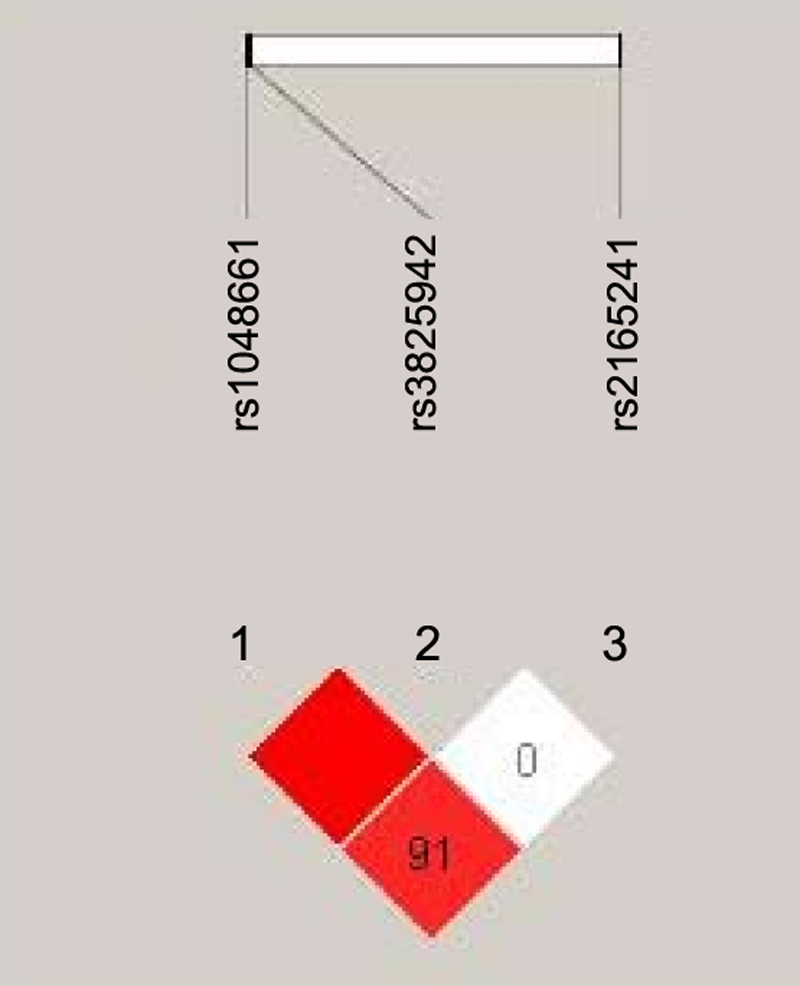
Figure 1. Analysis of linkage
disequilibrium (LD) among the three SNPs of
LOXL1. The SNPs
rs1048661
and
rs3825942,
and
rs1048661
and
rs2165241
were in strong LD, but
rs3825942
and
rs2165241
were not in LD. The numbers “91” and “0” in the check indicate 100×D’
(D’ means coefficient of linkage disequilibrium).
 Figure 1 of Chen, Mol Vis 2009; 15:2349-2357.
  Figure 1 of Chen, Mol Vis 2009; 15:2349-2357.