Figure 1. Expression Array image. The image of 588 genes (see AtlasTM Human Cardiovascular Array in Methods) is shown specifically for the group of individuals with vascular deregulation. The
double spots marked with black frames show the most stable expressional difference in vascular deregulation (VD), normal-tension
(NTG) and high-tension (HTG) glaucoma patients groups versus controls. These double-spots are zoomed for the groups tested
(ZOOM), and the names of corresponding genes as well as their positions in Atlas are given.
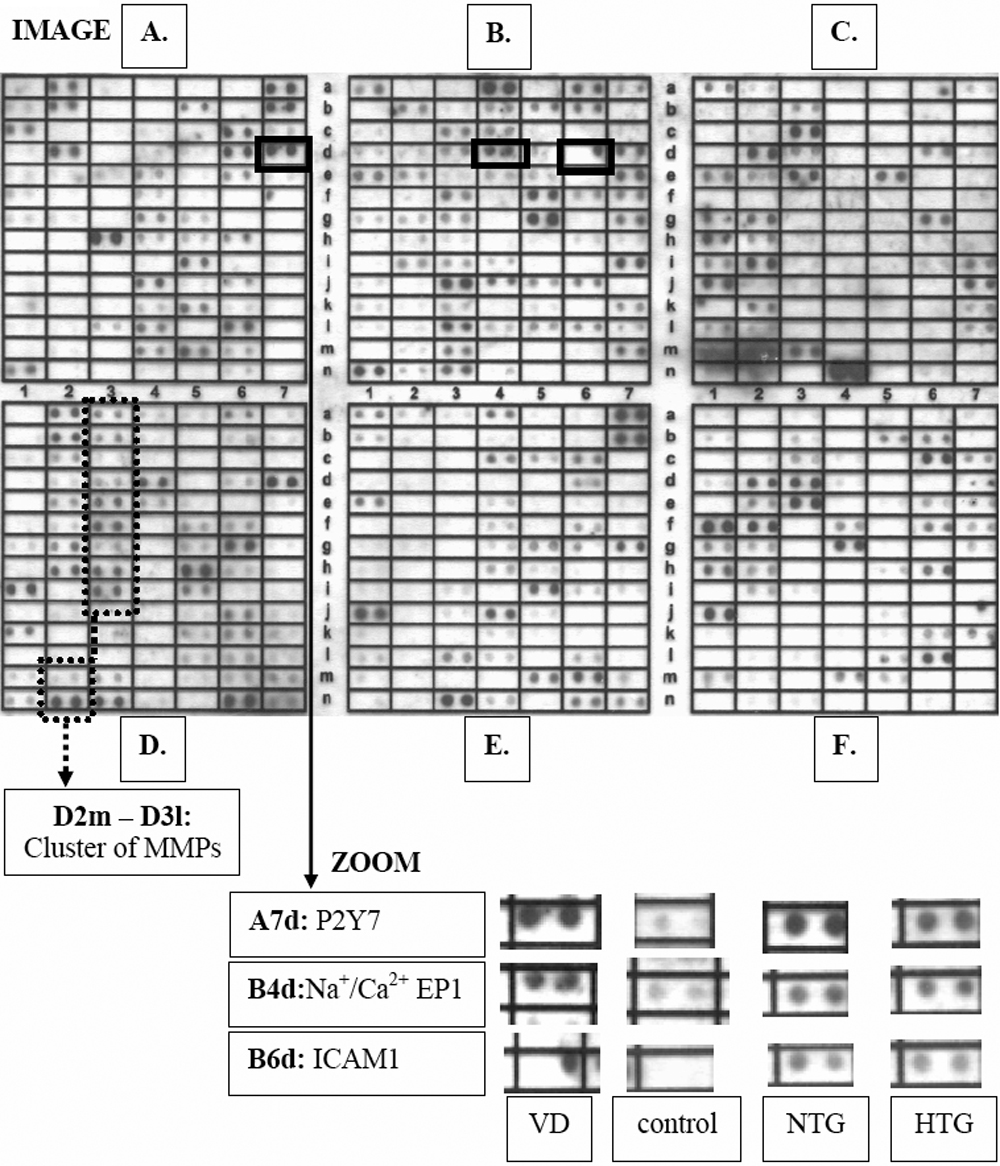
 Figure 1 of
Yeghiazaryan, Mol Vis 2009; 15:2339-2348.
Figure 1 of
Yeghiazaryan, Mol Vis 2009; 15:2339-2348.