Figure 1. Size exclusion chromatography of zebrafish lens homogenates during development and aging. Absorbance at 280 nm for detection
of proteins was plotted versus elution volume (x-axis), which corresponds with molecular size. Individual protein molecular
weight standards are shown at the bottom of the graph. High molecular weight aggregates elute early followed by a broad peak
of polydisperse α-crystallin oligomers with an average size of 24 subunits. Next, a broad peak of β-crystallin elutes from
the column, which forms octamers, tetramers, and dimers, and finally, γ-crystallins, which are monomeric, were observed. The
youngest lenses (4.5 days) were dominated by a large broad β-crystallin peak. α-Crystallin and γ-crystallin abundance increased
during lens maturation, and a high molecular weight peak, first observed at six months, increased with age to become the largest
peak by 2.5 years.
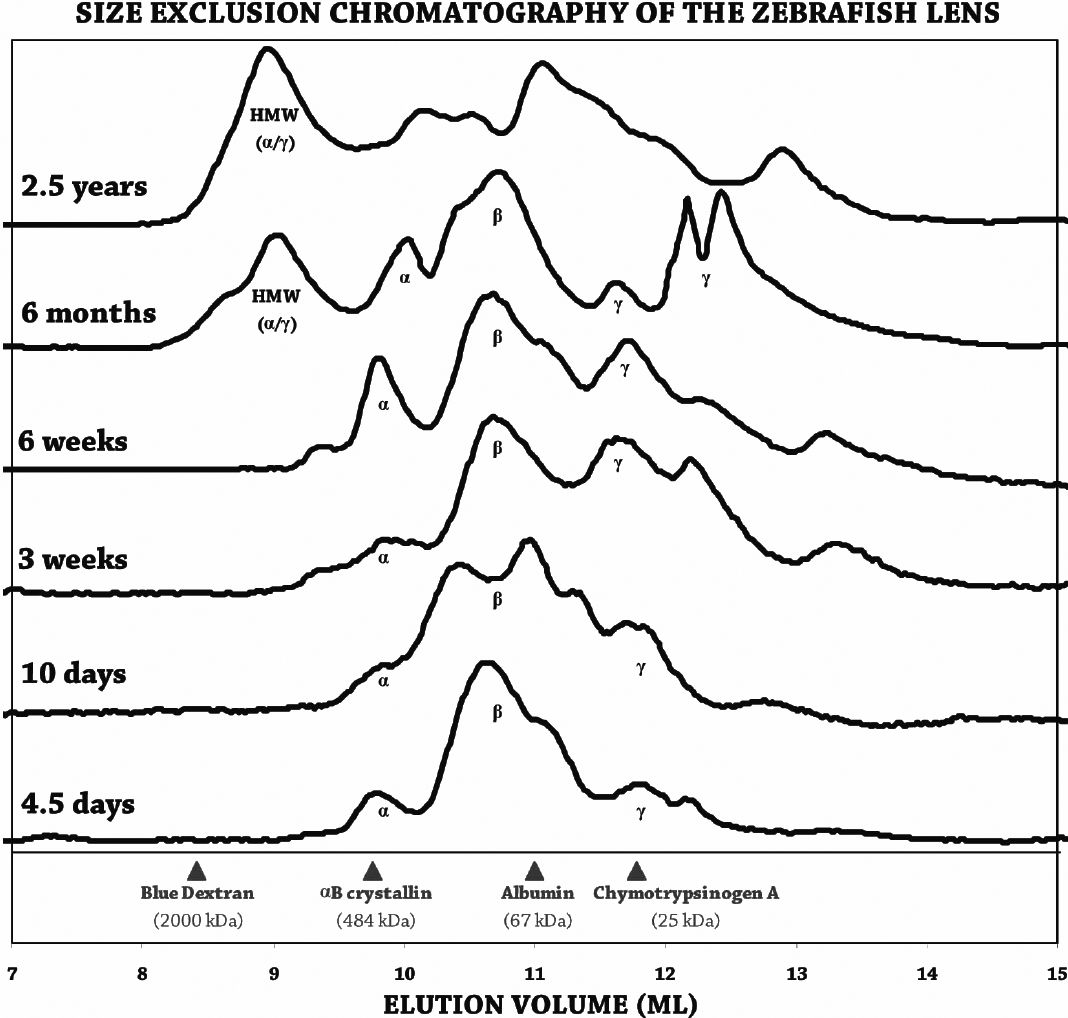
 Figure 1 of
Greiling, Mol Vis 2009; 15:2313-2325.
Figure 1 of
Greiling, Mol Vis 2009; 15:2313-2325.