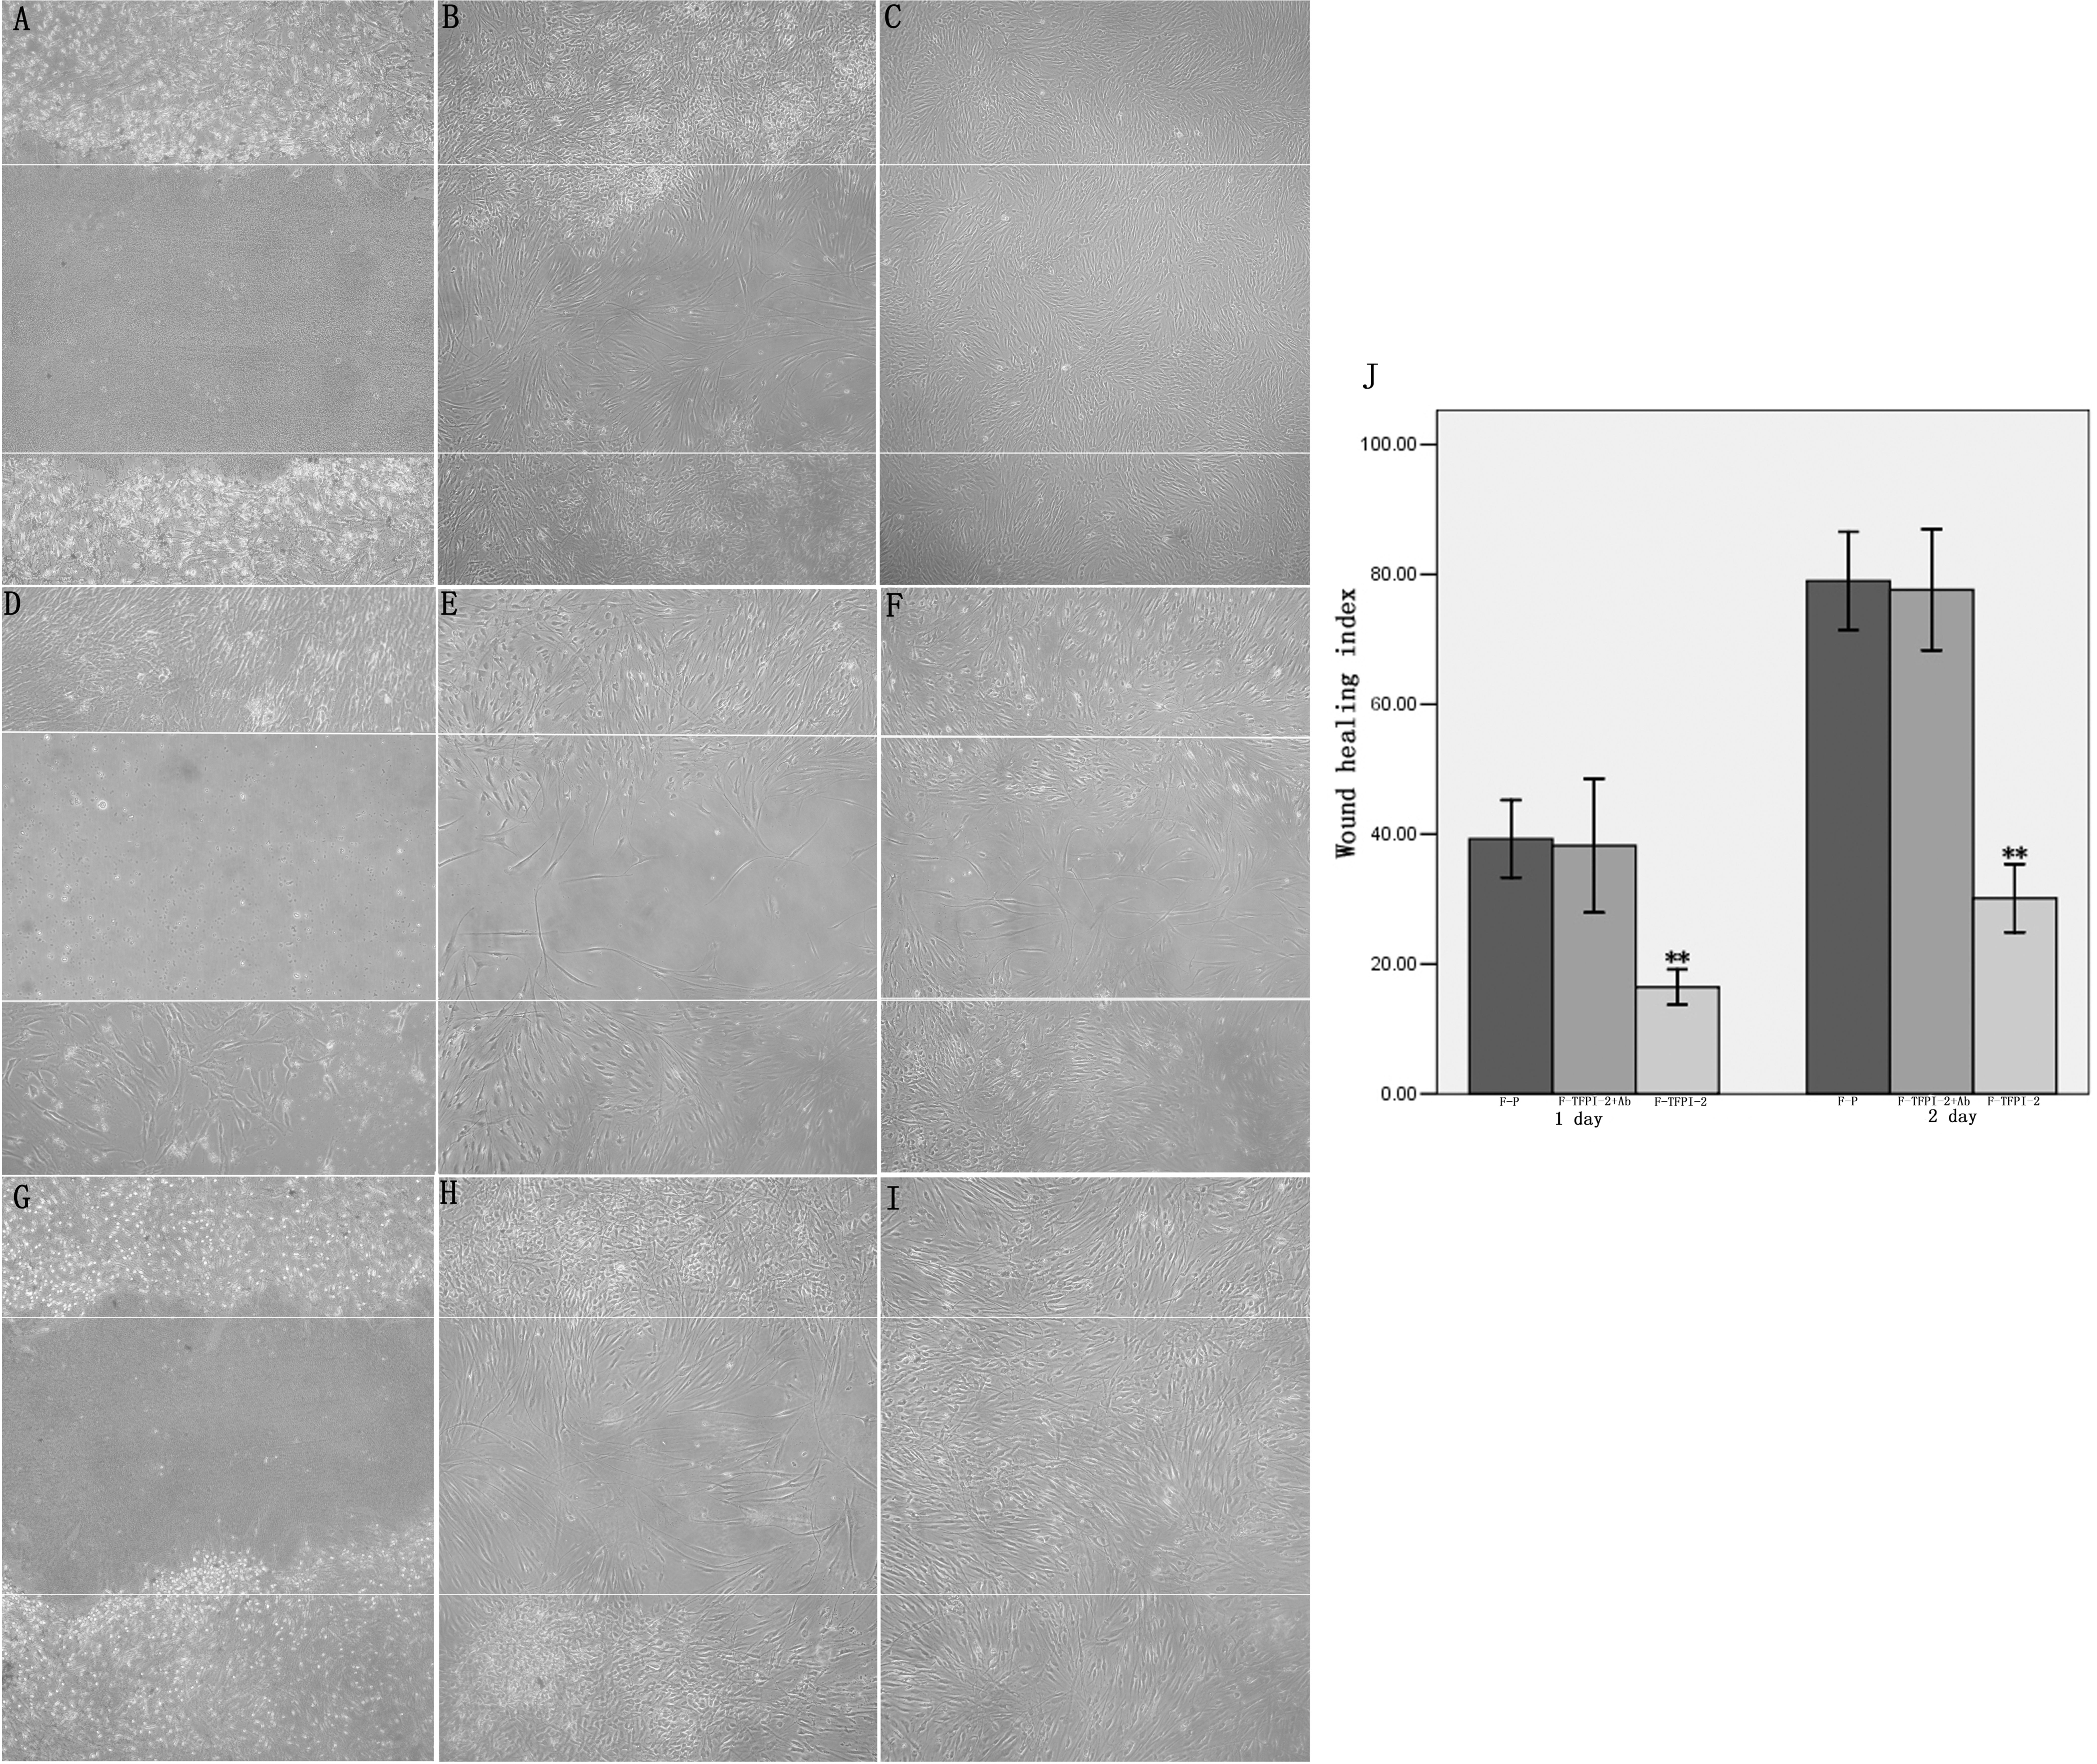
Figure 5. Overexpressioin of TFPI-2
reduces hTCF migration in the scratch-wound assay. A-I:
Phase contrast images of migration of F-P and F-TFPI-2 treated with or
without anti-TFPI-2 antibodies wounded with 1 mm strips at day T0, T1,
and T2. Bars, 200 μm. J: Quantification of cell migration at
day T1 and T2. Mean values from 3 different experiments are shown for
F-P, F-TFPI-2 with or without anti-TFPI-2 Ab in culture medium. The
double asterisk denotes a significant difference from F-P and F-TFPI-2
treated with anti-TFPI-2 antibodies versus F-TFPI-2 at p<0.001.

 Figure 5 of Jing, Mol Vis 2009; 15:2306-2312.
  Figure 5 of Jing, Mol Vis 2009; 15:2306-2312.