Figure 3. Contour diagram of FITC-Annexin V/PI flow cytometry of hTCFs for F-P, F-V, and F-TFPI-2. The lower right quadrant (region
4) represents the apoptotic cells. The percentages of the apoptotic cells population were 4.0%, 4.2%, and 4.3%, respectively.
One representative experiment out of three was shown.
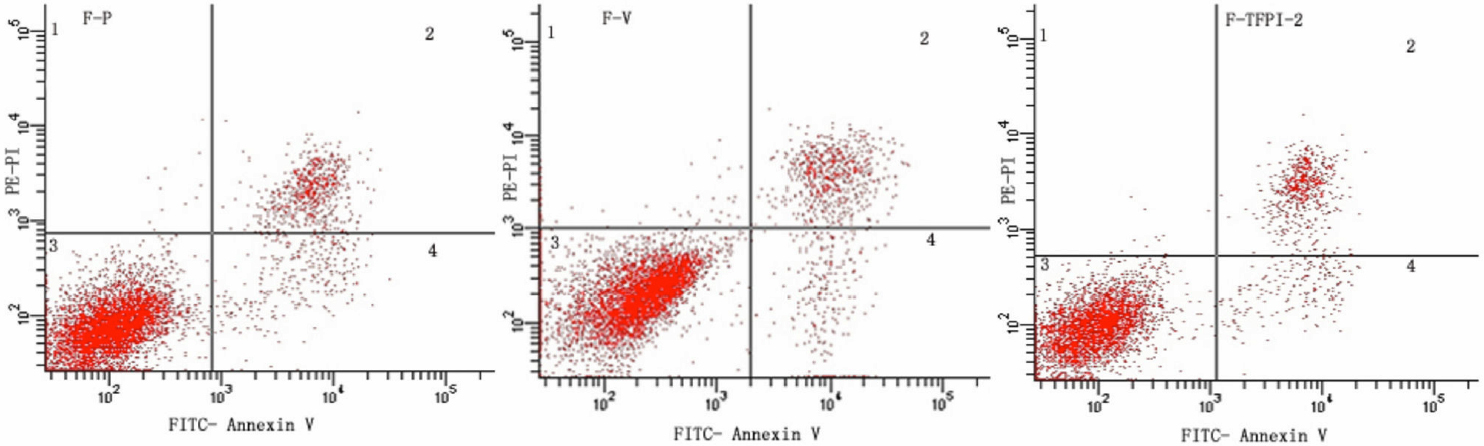
 Figure 3 of
Jing, Mol Vis 2009; 15:2306-2312.
Figure 3 of
Jing, Mol Vis 2009; 15:2306-2312.