Figure 1. Identification and expression of
tissue factor pathway inhibitor after gene transfection. A:
Restriciton enzyme analysis of TFPI-2 plasmids digested with XbaI and
KpnI. Line 1 is the 2-Log Marker. Line 2 is the pBos-Cite-neo/TFPI-2.
Line 3 is the pBos-Cite-neo/TFPI-2 digested with XbaI and KpnI. Line 4
is the λDNA/EcoRI+HindIII Markers. B: Semi-quantification of
TFPI-2 mRNA expression in hTCFs after transfection with an empty vector
or TFPI-2 expression vector was assessed by RT-PCR. RT-PCR for β-actin
mRNA was performed as a control. Relative OD Value (OD TFPI-2/OD
β-actin) was used to evaluate the expression level of TFPI-2. Data are
presented as mean value±SD, the double asterisk indicates a p<0.001,
Student’s t-test. C: Western blot analysis for the expression
of TFPI-2 in hTCFs after transfection with an empty vector or TFPI-2
expression vector. Each protein fraction was subjected to sodium
dodecyl sulfate-polyacrylamide gel electrophoresis on 15% acrylamide
gels, transferred onto nitrocellulose membranes, and probed with a
rabbit anti-human TFPI-2 antibody. Molecular sizes of the detected
bands are shown to be 33, 31, and 27 kDa.
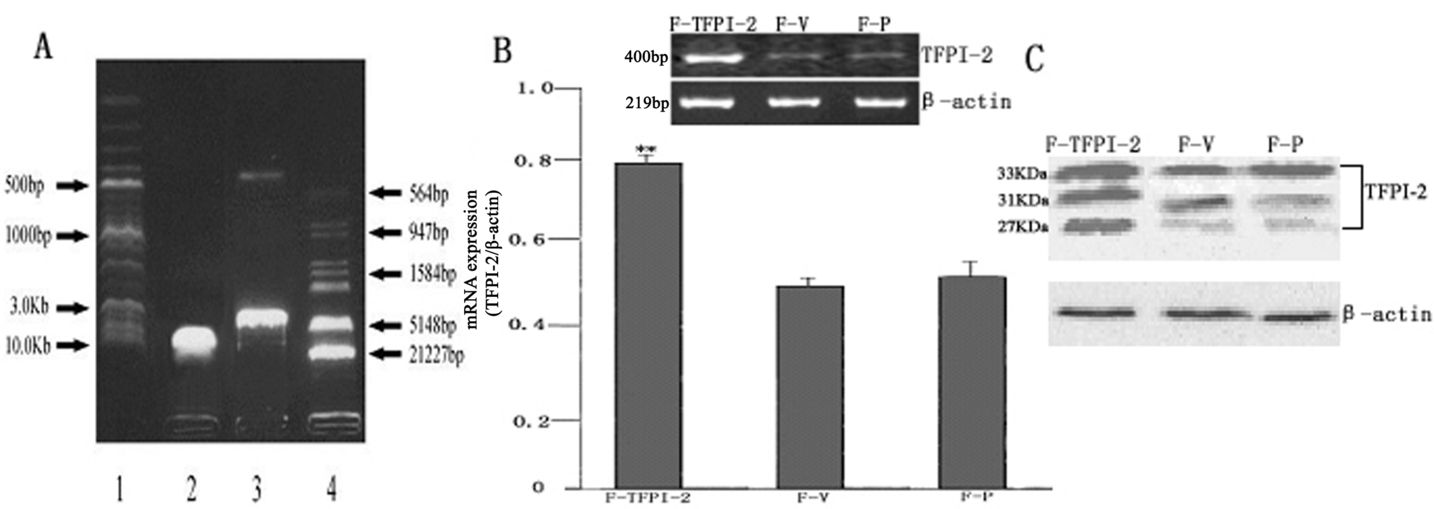
 Figure 1 of Jing, Mol Vis 2009; 15:2306-2312.