Figure 2 of
Micheal, Mol Vis 2009; 15:2268-2278.
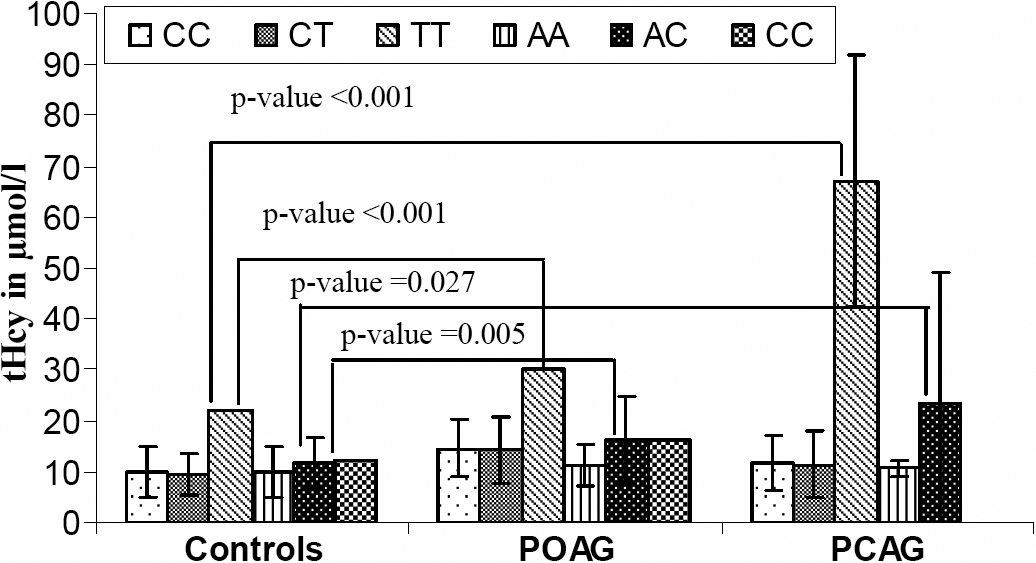
Figure 2.
Mean plasma homocysteine levels in C677T and A1298C genotypes in controls, POAG, and PCAG samples. Error bars indicate standard error of the mean.
 Figure 2 of Micheal, Mol Vis 2009; 15:2268-2278.