Figure 1. Transcription factor array
comparing normal and cataractous LEC. A-C: The TransSignal™
(Panomics) TF-TF interaction array using one normal and two cataractous
canine LEC samples. Nuclear extract was mixed with the TransSignal
Probe mix, and immunoprecipitation was performed using a polyclonal
antibody to TERT (Calbiochem, San Diego, CA). A: Normal sample
from an approximately seven- to nine-year-old dog. B: Diabetic
cataract from an approximately seven- to nine-year-old dog. C:
Breed-related cataract from an approximately seven- to nine-year-old
dog. Each TF is spotted on the blot in duplicate at the same
concentration and then directly below those two spots at a 1:10
dilution in duplicate. Four of the TFs are boxed to show signal
intensity differences: ERE (1), p53 (2), Sp1 (3), and MRE (4). It is
evident that the normal sample shows less spot intensity of these TFs
when compared to the cataract samples. D: Graph depiction of
the four TFs boxed in A-C demonstrating interaction of
TERT with ERE, p53, Sp1, and MRE. The cataractous samples had higher
signal intensity than the normal samples. The normal samples showed
some interaction of TERT with ERE, Sp1, and MRE. However, there was no
p53 interaction with TERT. The blots shown are representative of
repeated experiments. Error bars indicate standard error of the mean
(SEM).
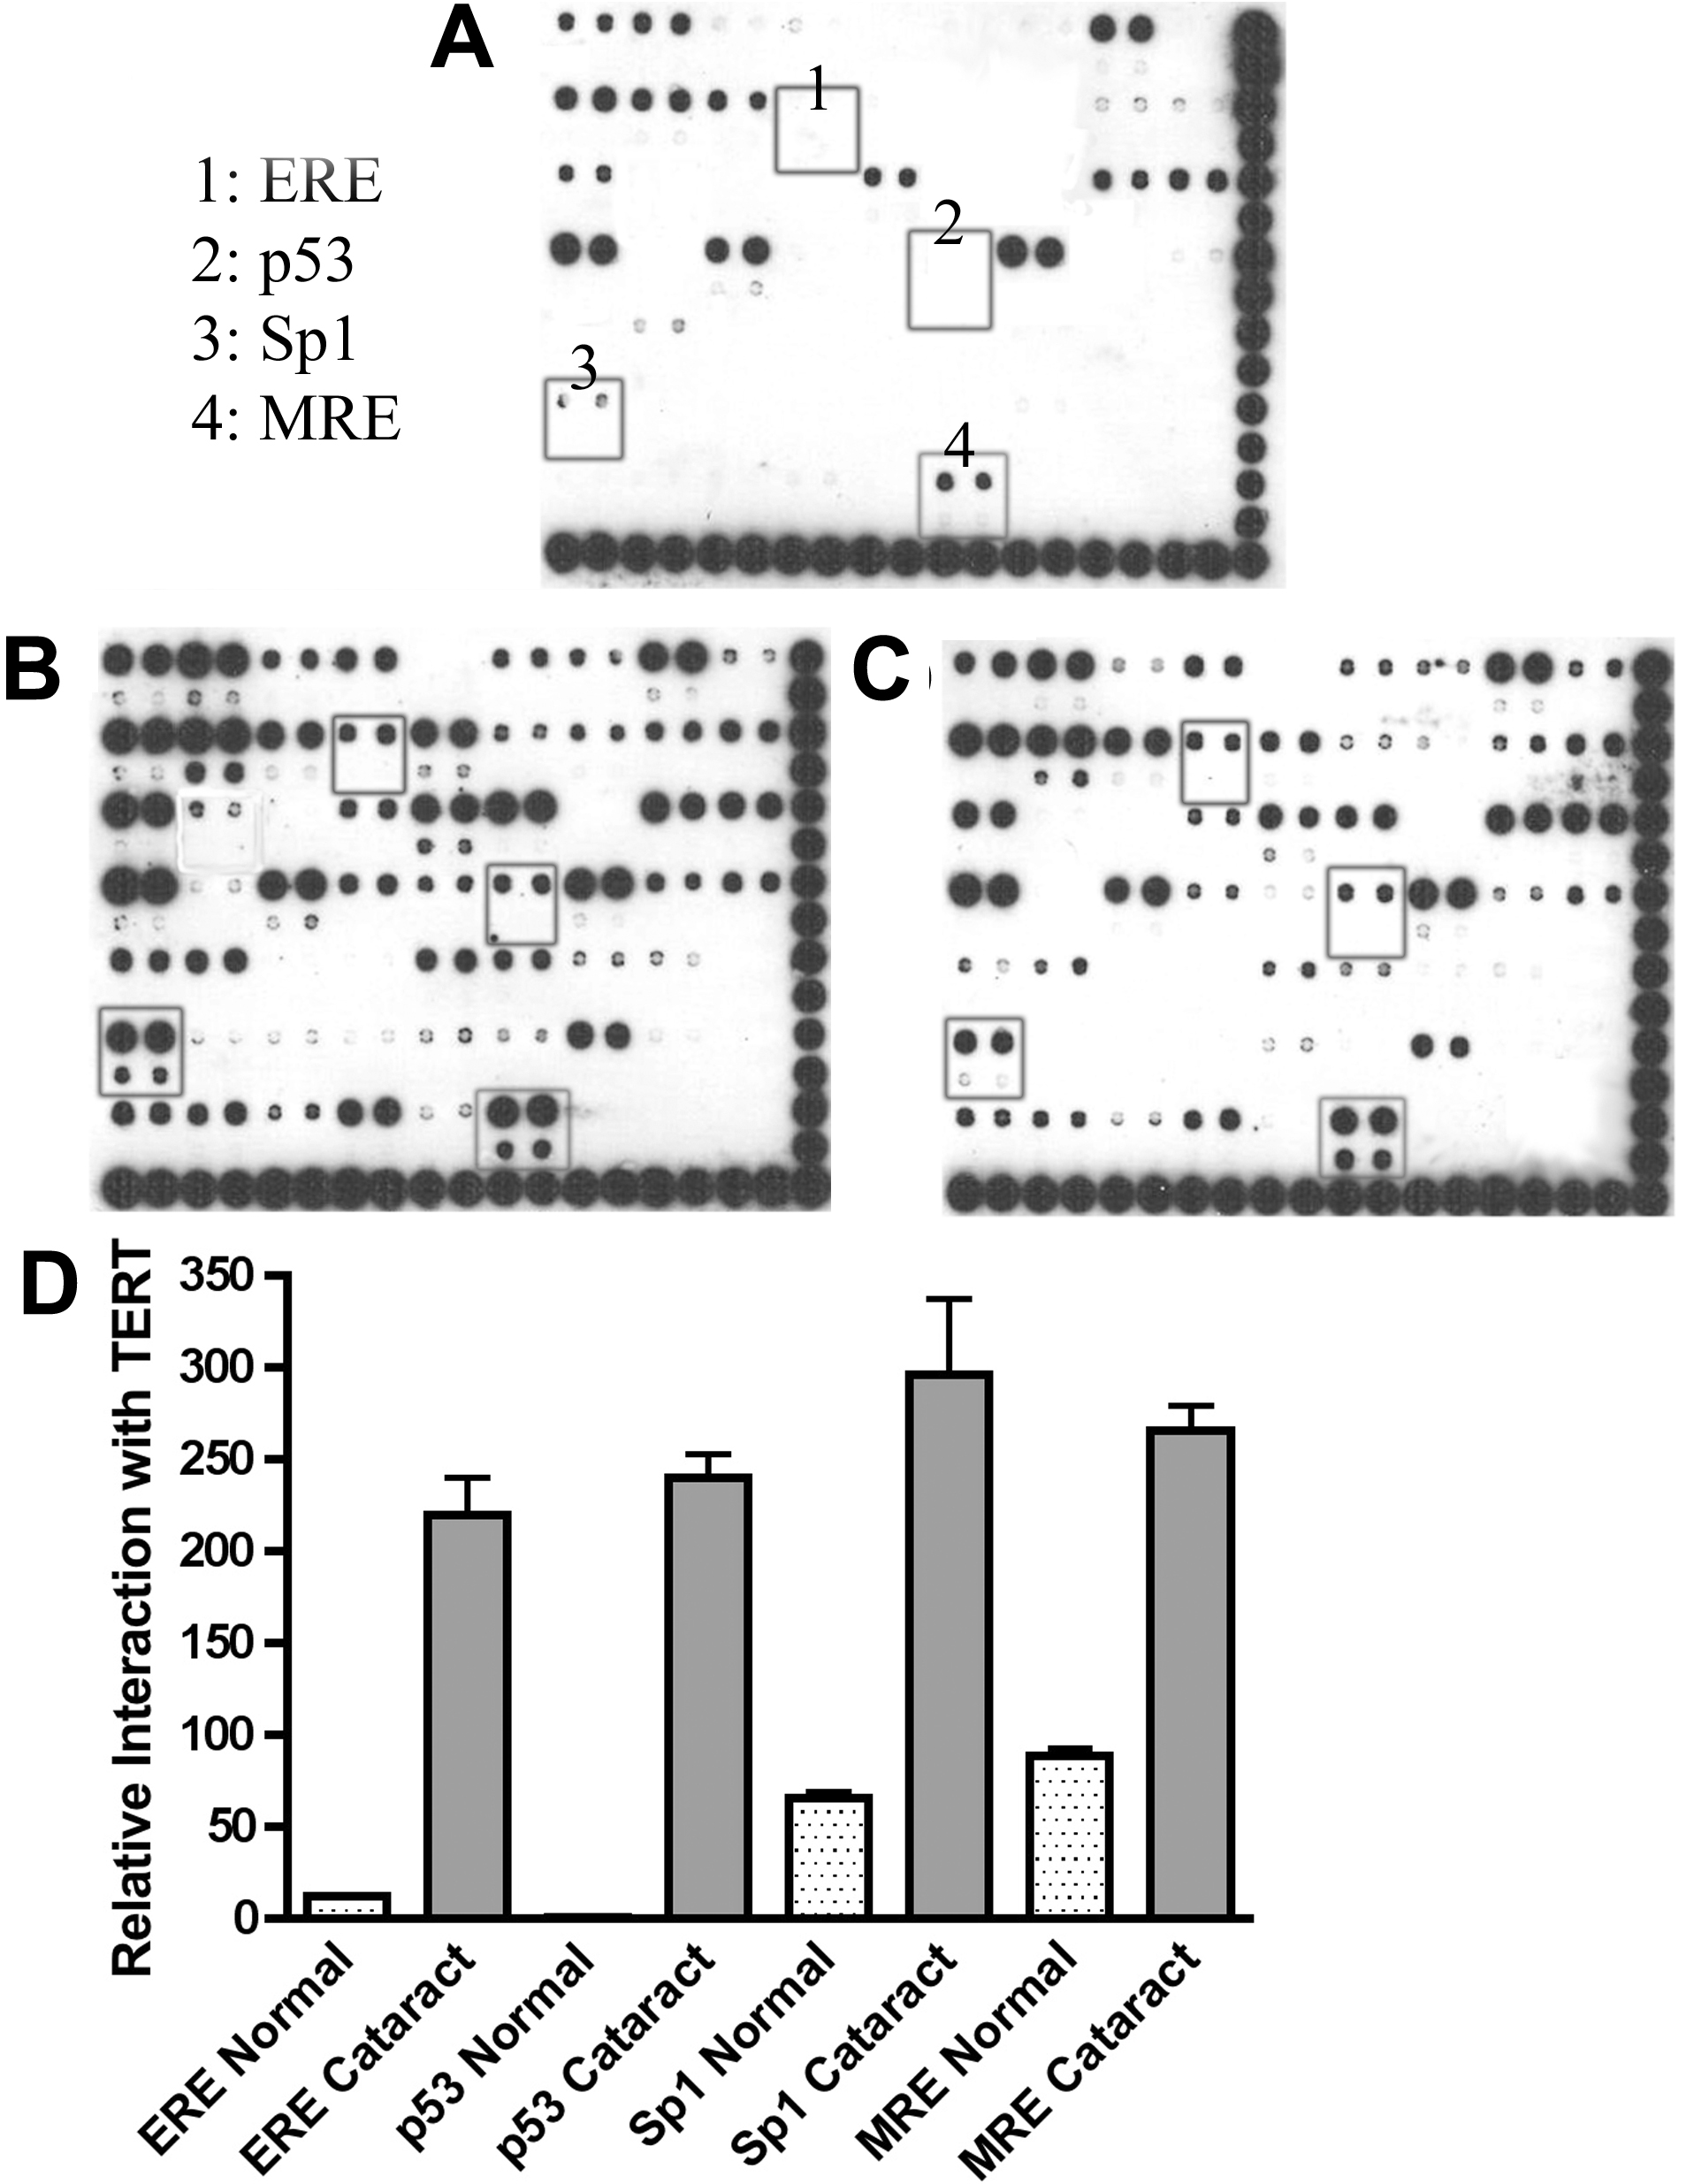
 Figure 1 of Colitz, Mol Vis 2009; 15:2259-2267.