Figure 3. qPCR measurements of retinal
nNOS transcripts using an Applied Biosystems TaqMan™ assay. No
difference was seen between control and diabetic nNOS mRNA levels. The
values are depicted as mean normalized expression (MNE) compared to the
18s rRNA (n=4). The data were analyzed using the qGene template [
30],
using the
following equation:
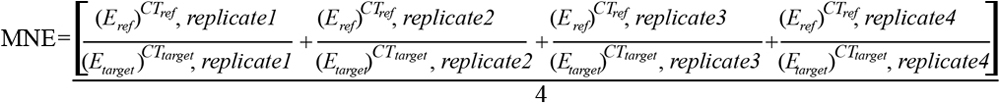
where;
E
target, PCR amplification efficiency of the target gene; E
ref,
PCR amplification efficiency of the reference gene; CT
target,
threshold cycle of the PCR amplification of the target gene; CT
ref,
threshold cycle of the PCR amplification of the reference gene. The CT
was defined as the cycle at which the fluorescence rises appreciably
above the background fluorescence and determined automatically using
Applied Biosystems SDS software version 2.3.
 Figure 3 of Giove, Mol Vis 2009; 15:2249-2258.