Figure 2. nNOS protein levels decreased
after 5 weeks of diabetes. A: Mean fluorescence levels of nNOS
immunoreactivity were significantly reduced in the outerplexiform layer
(OPL), inner nuclear layer (INL), inner plexiform layer (IPL), and
ganglion cell layer (GCL) when compared to controls (n=11). The graph
on the right indicates the line profile average of the intensity of
nNOS in each layer of the retina. B: nNOS immunoreactivity in
the IPL no longer filled neuronal processes in the diabetic and was
localized in structures which resembled synaptic boutons in size and
location. C: western blots detected a single ~160 kDa band
consistent with nNOS. Levels of β-tubulin are shown to confirm equal
protein loading. There was a 24%±11 decrease in total nNOS protein (C
is control, D is diabetic; n=8). Line on the left indicates the
location of the 150 kDa molecular weight marker.
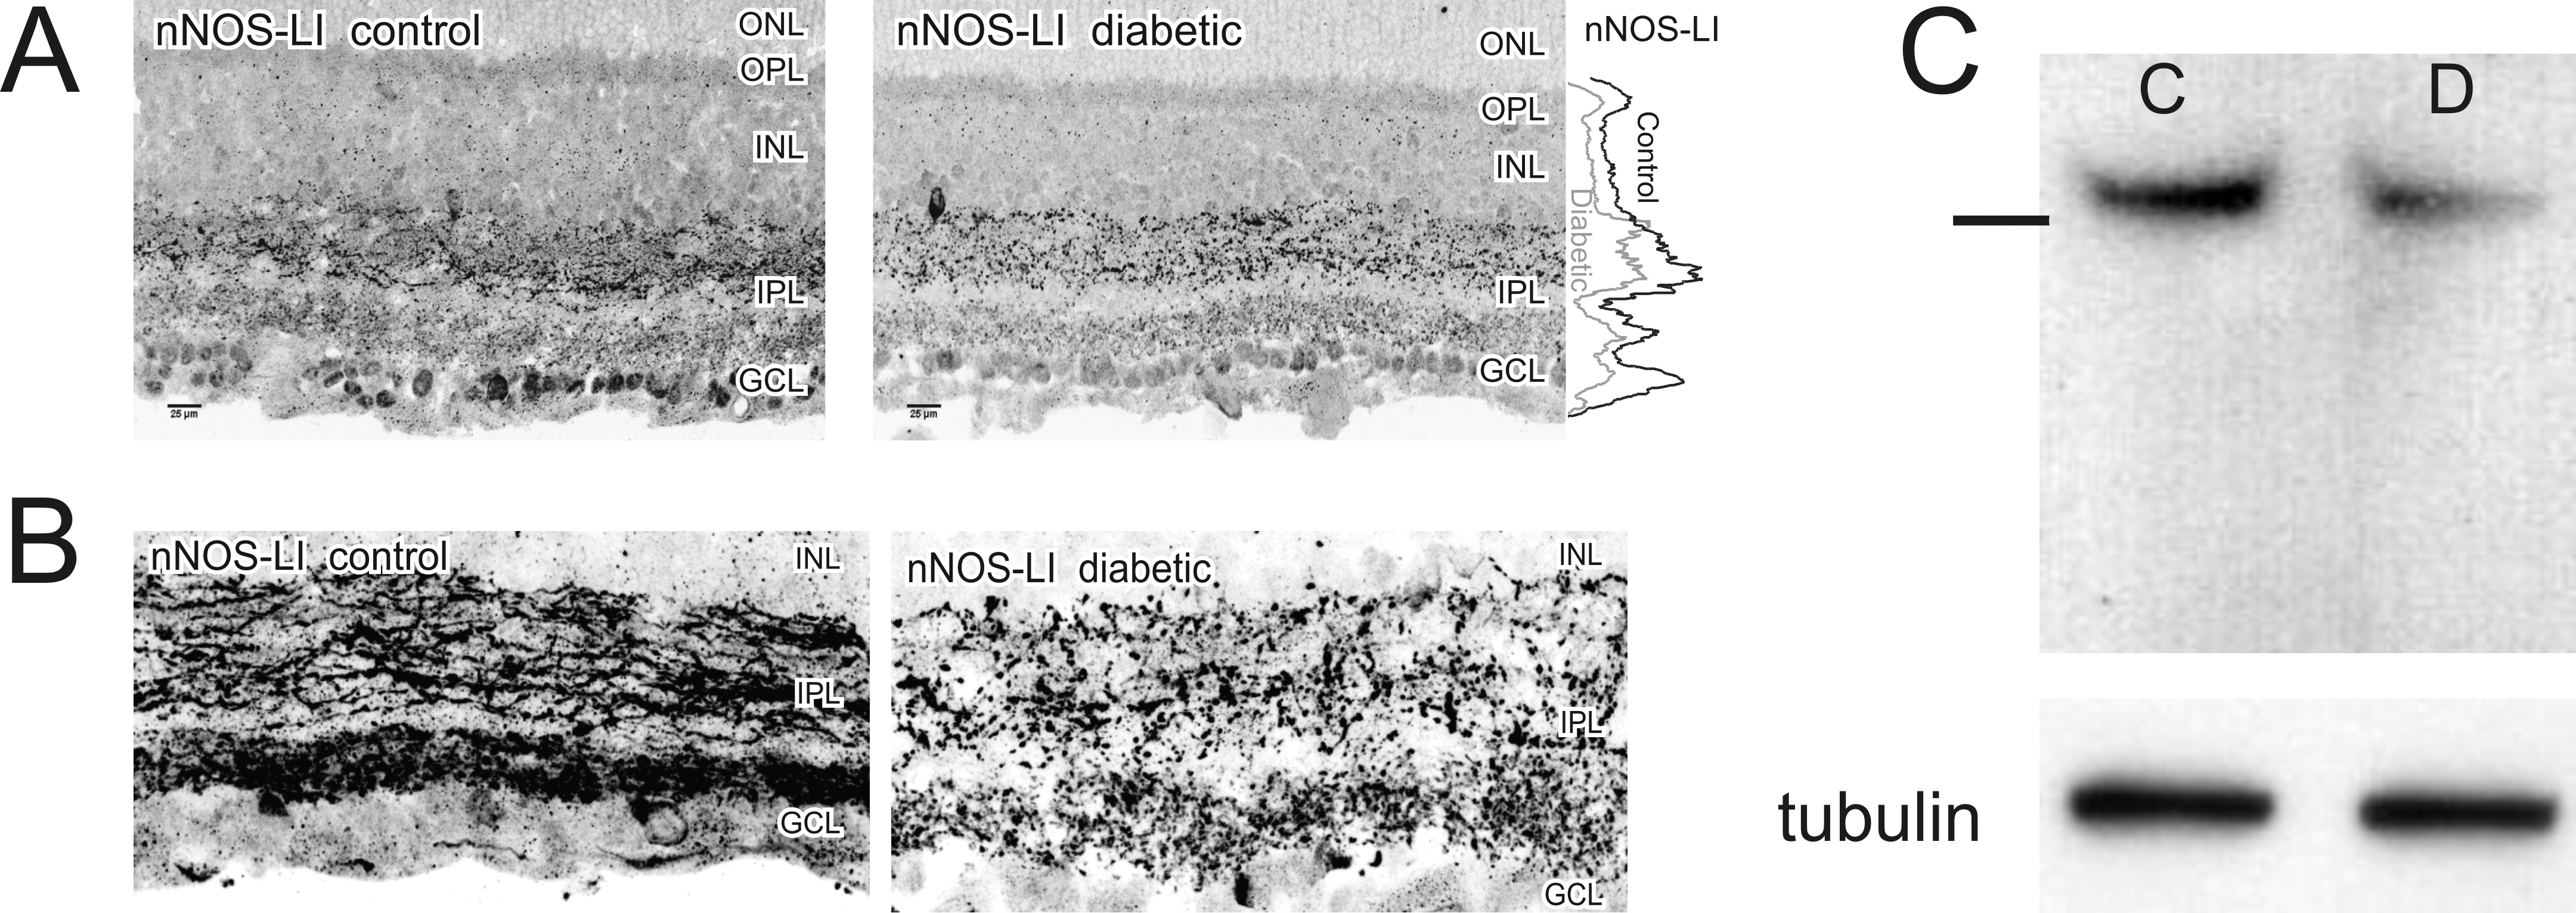
 Figure 2 of Giove, Mol Vis 2009; 15:2249-2258.