Figure 1. Changes in NO-induced
fluorescence (NO-IF) in the diabetic retina. A: NO-IF increased
in the diabetic retina compared to control. NO-IF in processes from
somata in the inner nuclear layer (INL) were present in control (white
arrowhead) but absent in the diabetic. Treatment with insulin or
aminoguanidine (AG) reduced NO-IF and insulin restored NO-IF in some
the processes in the INL (white arrowheads). Scale bars represent 25
μm. Quantitative analysis of NO-IF in retinal regions is shown in
dark-adapted unstimulated (B) and light-stimulated retinas (C)
as compared to control (100%). The outer and inner plexiform layers
(OPL and IPL) depict the percent intensity, while the inner nuclear
layer (INL) and ganglion cell layer (GCL) depict the percent of NO-IF
labeled somata. B, C: Like symbols indicate statistically
significant differences between groups (* represents diabetic versus
control OPL, # represents diabetes versus control IPL; p<0.05).
Error bars represent SD.
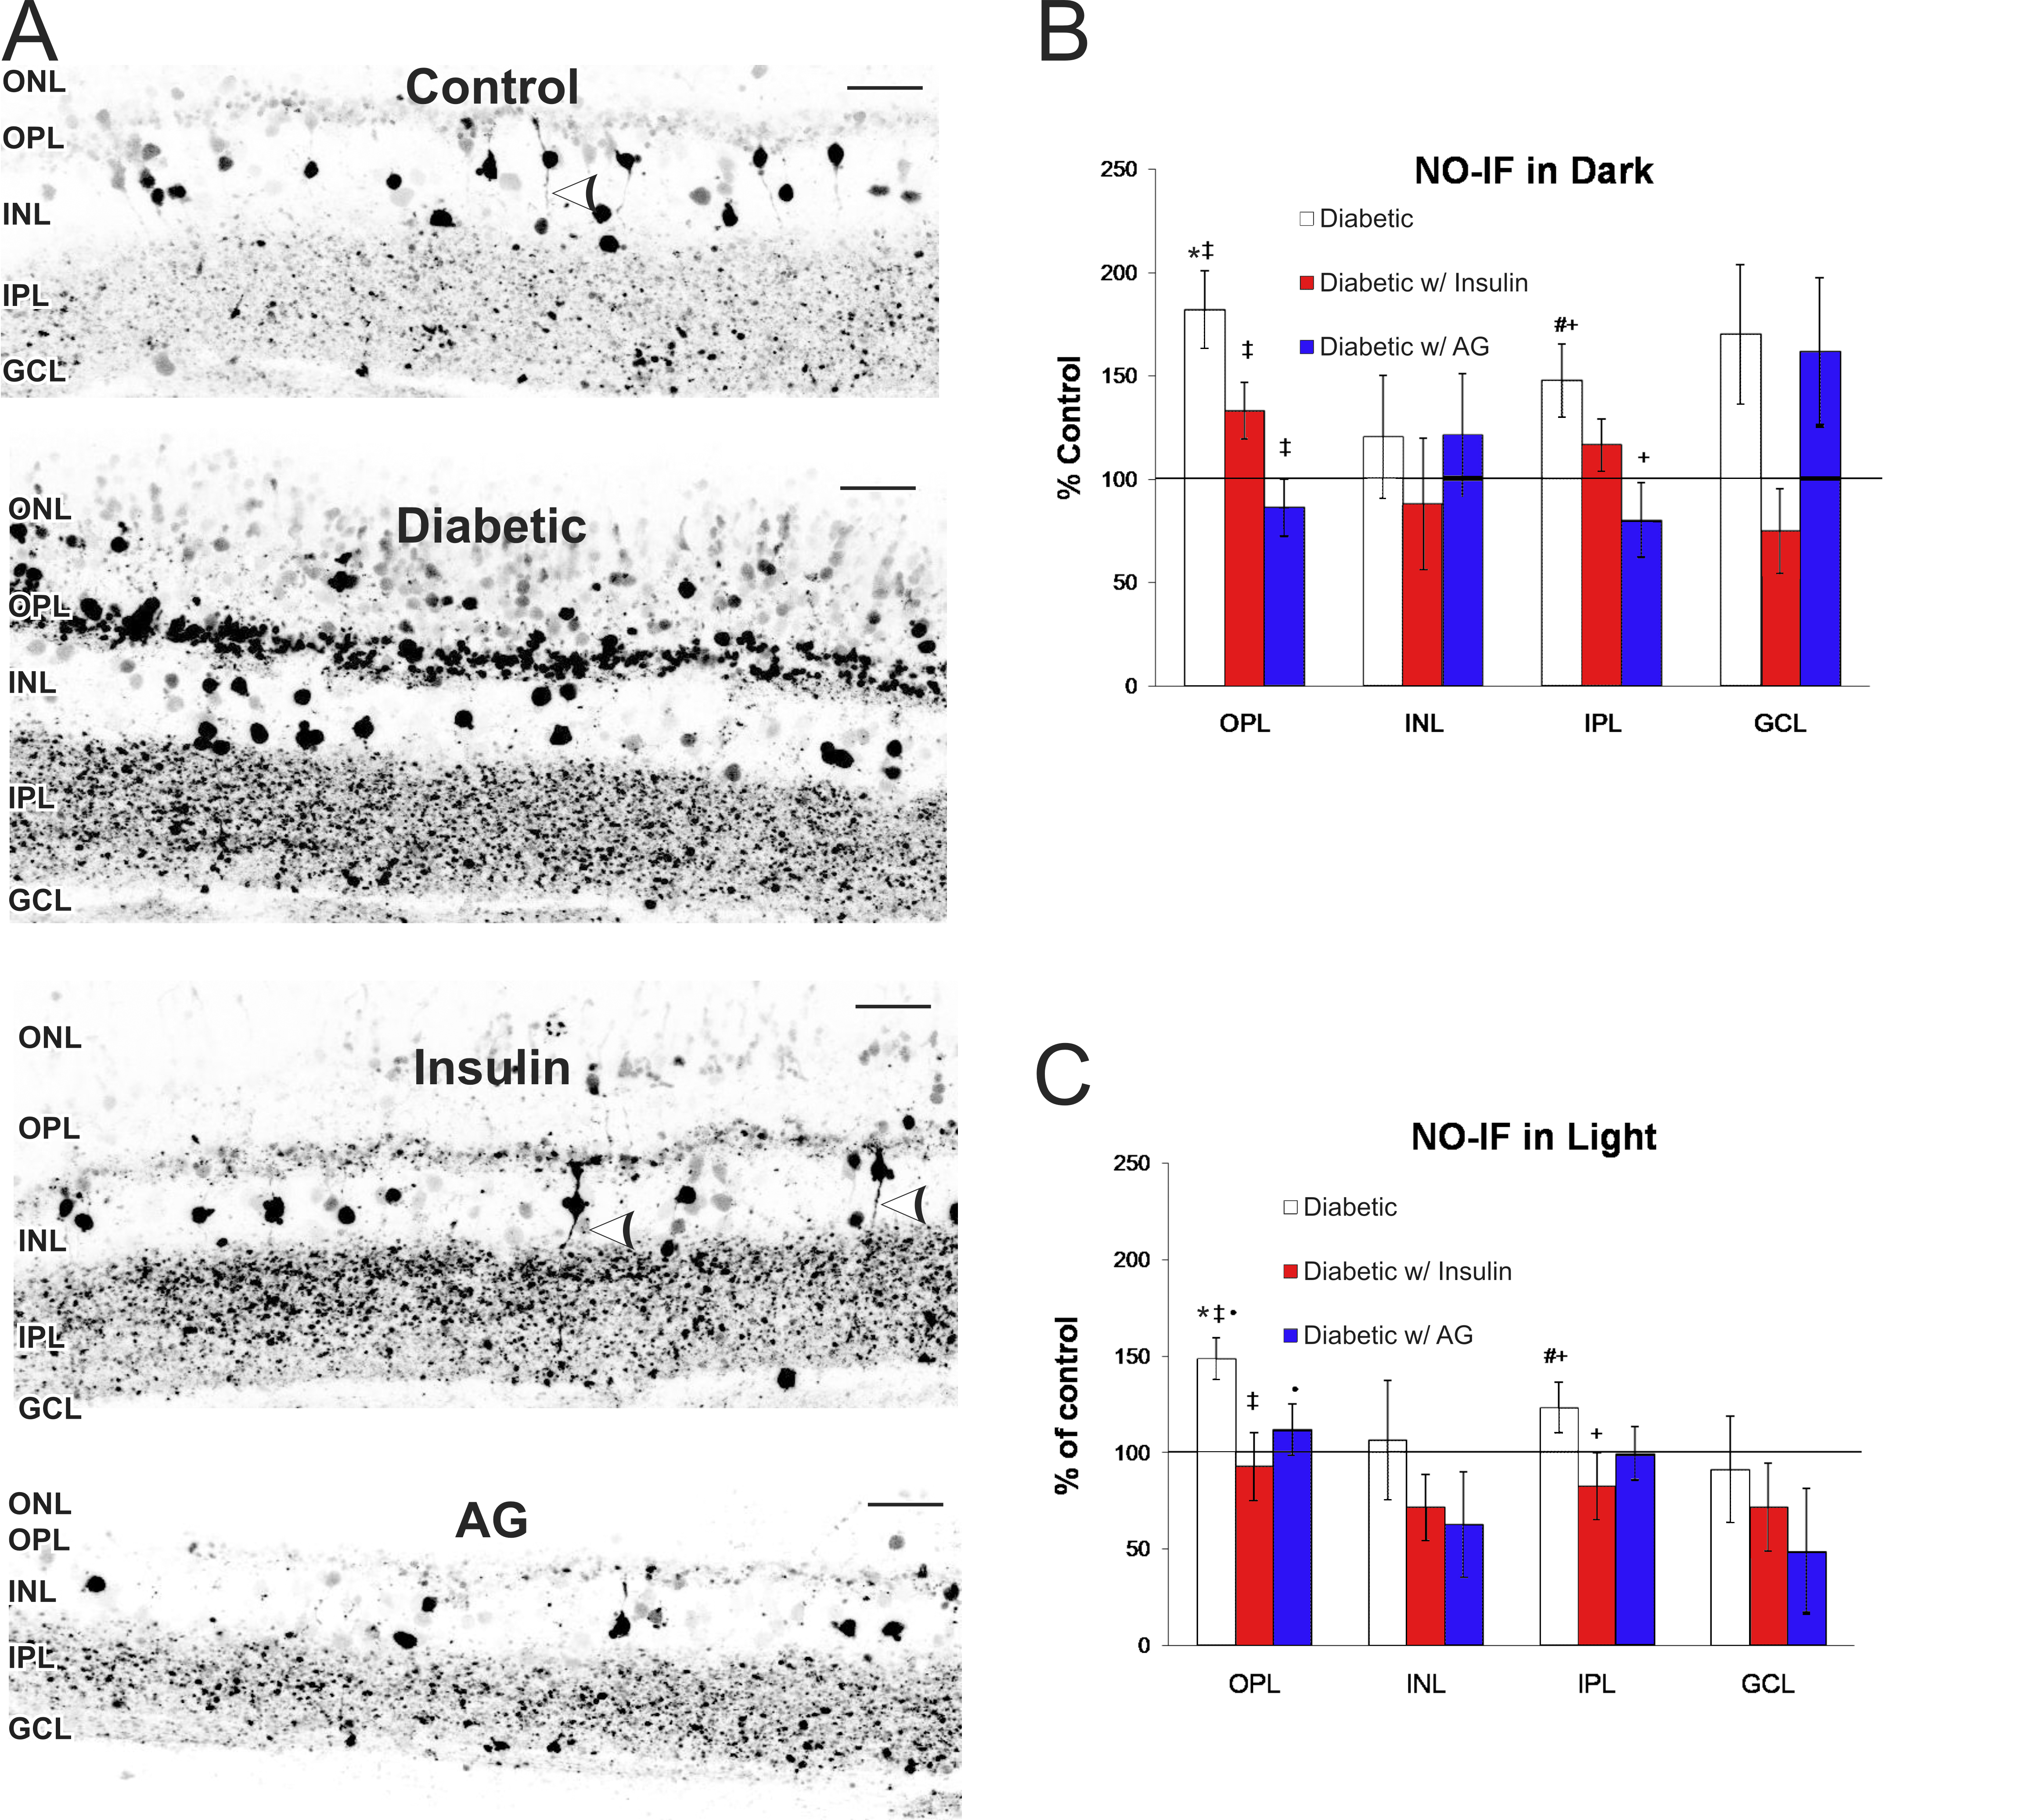
 Figure 1 of Giove, Mol Vis 2009; 15:2249-2258.