Figure 5. Immunocytochemical detection of E-cadherin on human corneal epithelial cells. E-cadherin expression (red) in wounded cells
at different concentration of amniotic membrane suspensions (0% [A], 5% [B], 30% [C], and positive control groups [D]) are shown at 100X magnification. Cell nuclei were stained with 4',6-diamidino-2-phenylindole (blue). The levels of E-cadherin
expression were increased gradually according to the amniotic membrane concentration (Scale bar, 200 μm).
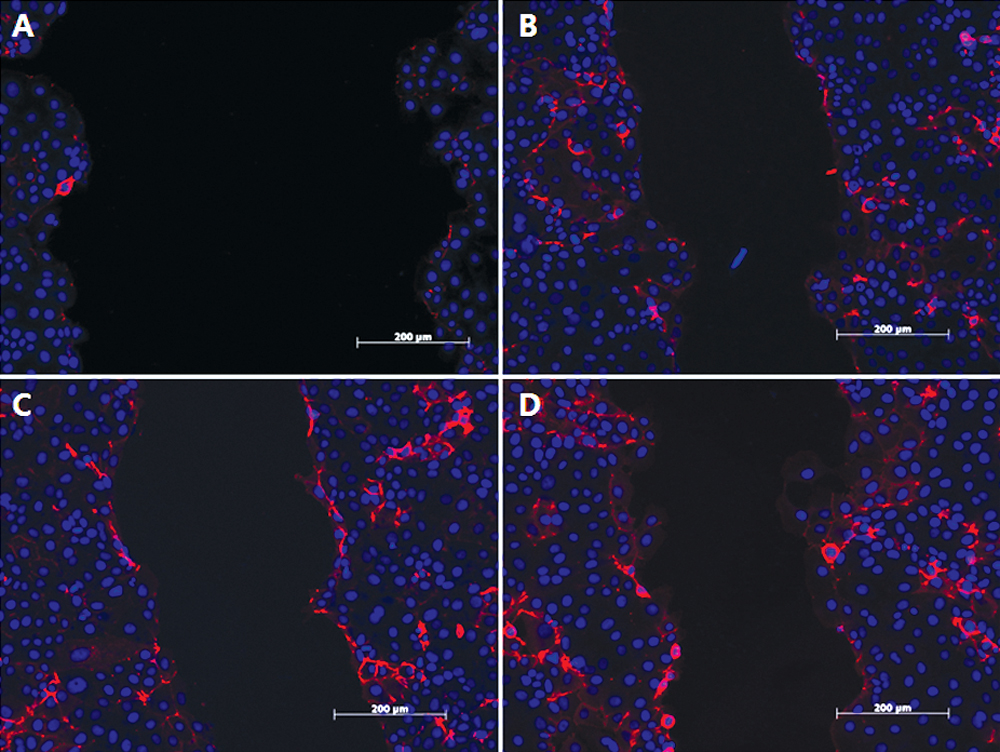
 Figure 5 of
Choi, Mol Vis 2009; 15:2230-2238.
Figure 5 of
Choi, Mol Vis 2009; 15:2230-2238.