Figure 5. GFAP and MAC-1 staining in the
LGN and area V1. A: In the LGN of the ONT brains, GFAP
immunoreactive cells (black bars, 14.2±0.4 SD) are larger than the
MAC-1 immunoreactive cells (white bars, 10.5±0.4 SD). In V1, GFAP
immunoreactive cells were again larger (black bar, 11.8±0.9 SD) than
the MAC-1 immunoreactive cells (white bar, 9.5±0.4 SD). Asterisks
indicate significance at the p<0.05 level. B: A comparison
of the GFAP immunoreactive cells in the LGN of ONT (14.2±0.4 SD) and
OHT (14.0±0.3 SD) brains revealed that the two populations were
indistinguishable based on cell size. A similar comparison of GFAP
immunoreactive cells in V1 of ONT (11.8±0.9 SD) and OHT (11.1±1.1 SD)
revealed no difference in the size range in GFAP immunoreactive cells
in V1.
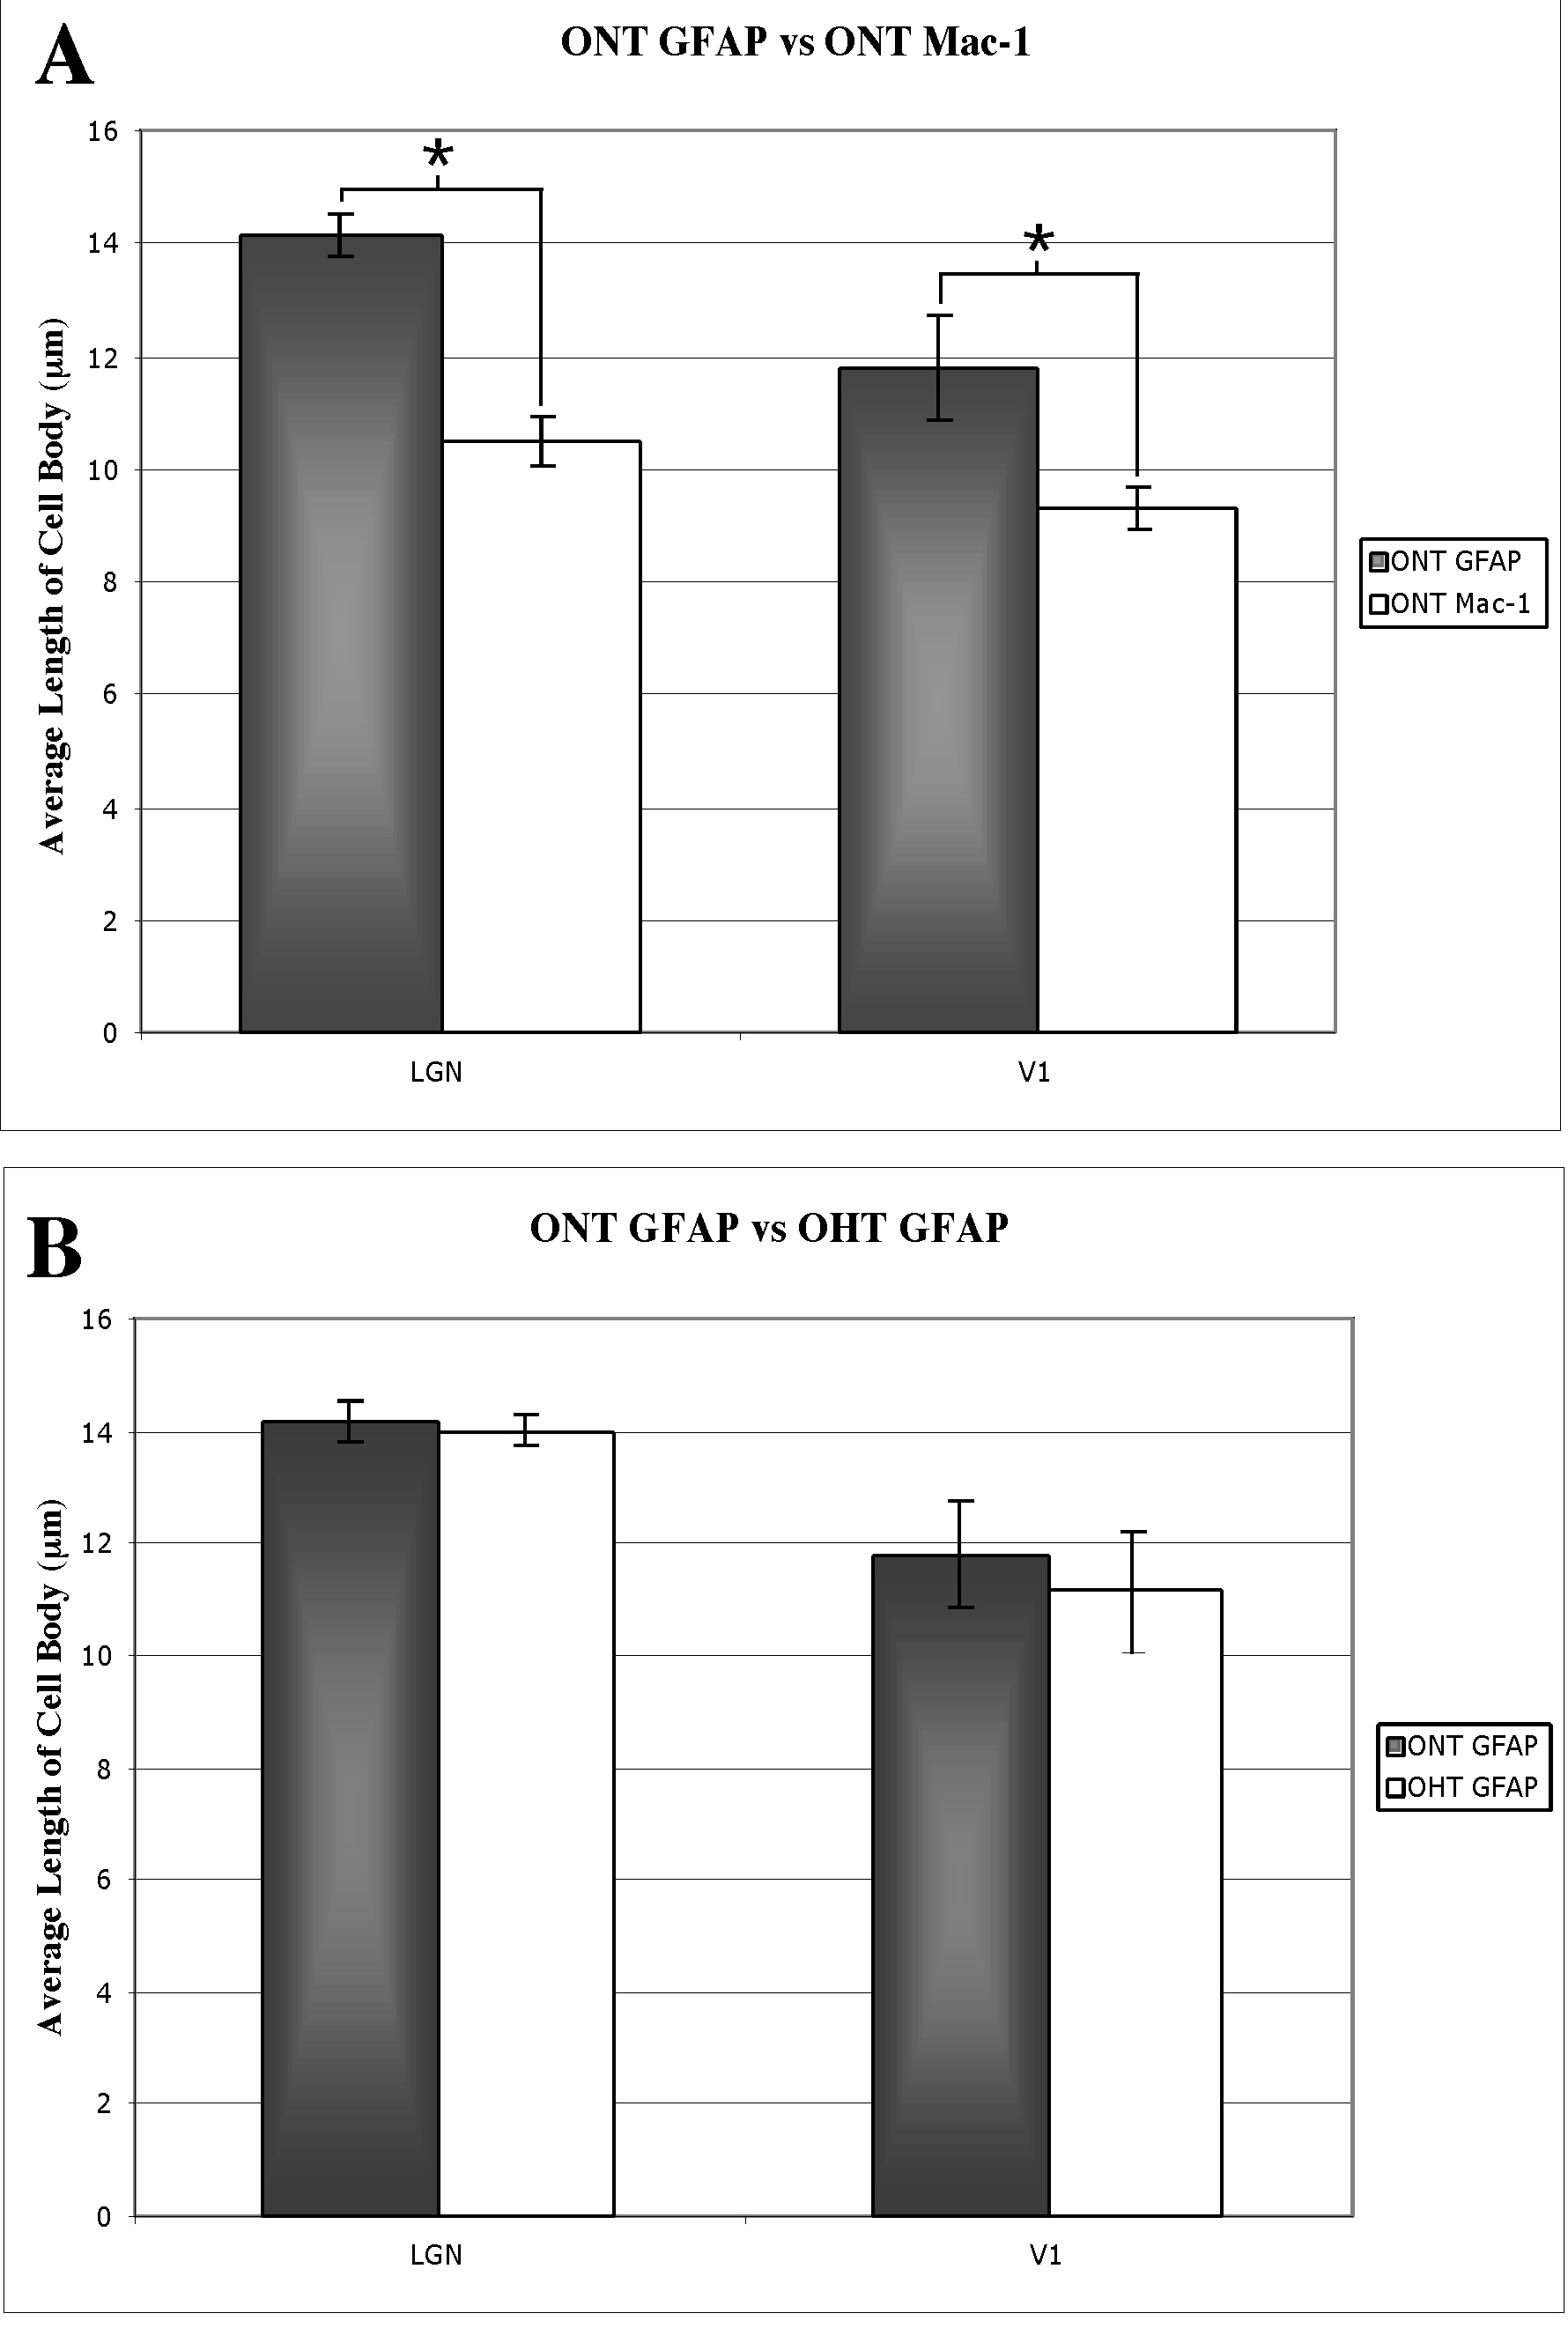
 Figure 5 of Lam, Mol Vis 2009; 15:2217-2229.