Figure 4. Photomicrographs of serial
tangential sections through layer 4C of V1 from an OHT brain. A:
Section stained for CO histochemistry demonstrates ocular dominance
bands in tangential sections through layer 4C of V1. Note the treated
eye bands (d) demonstrate lighter, less dense CO staining. B: A
serial section stained for GFAP immunohistochemistry demonstrates
denser, more robust immunoreactivity in the ocular dominance bands
associated with the treated eye (d). C: A serial section
stained for MAC-1 immunohistochemistry demonstrates uniform
immunoreactivity. Arrows point to high power photographs (100X) of the
treated and normal ocular dominance bands stained for CO (D, E),
GFAP (F, G), or MAC-1 (H, I). Note
astrocytic profiles and processes in F and lack of labeled
microglial profiles in H and I.
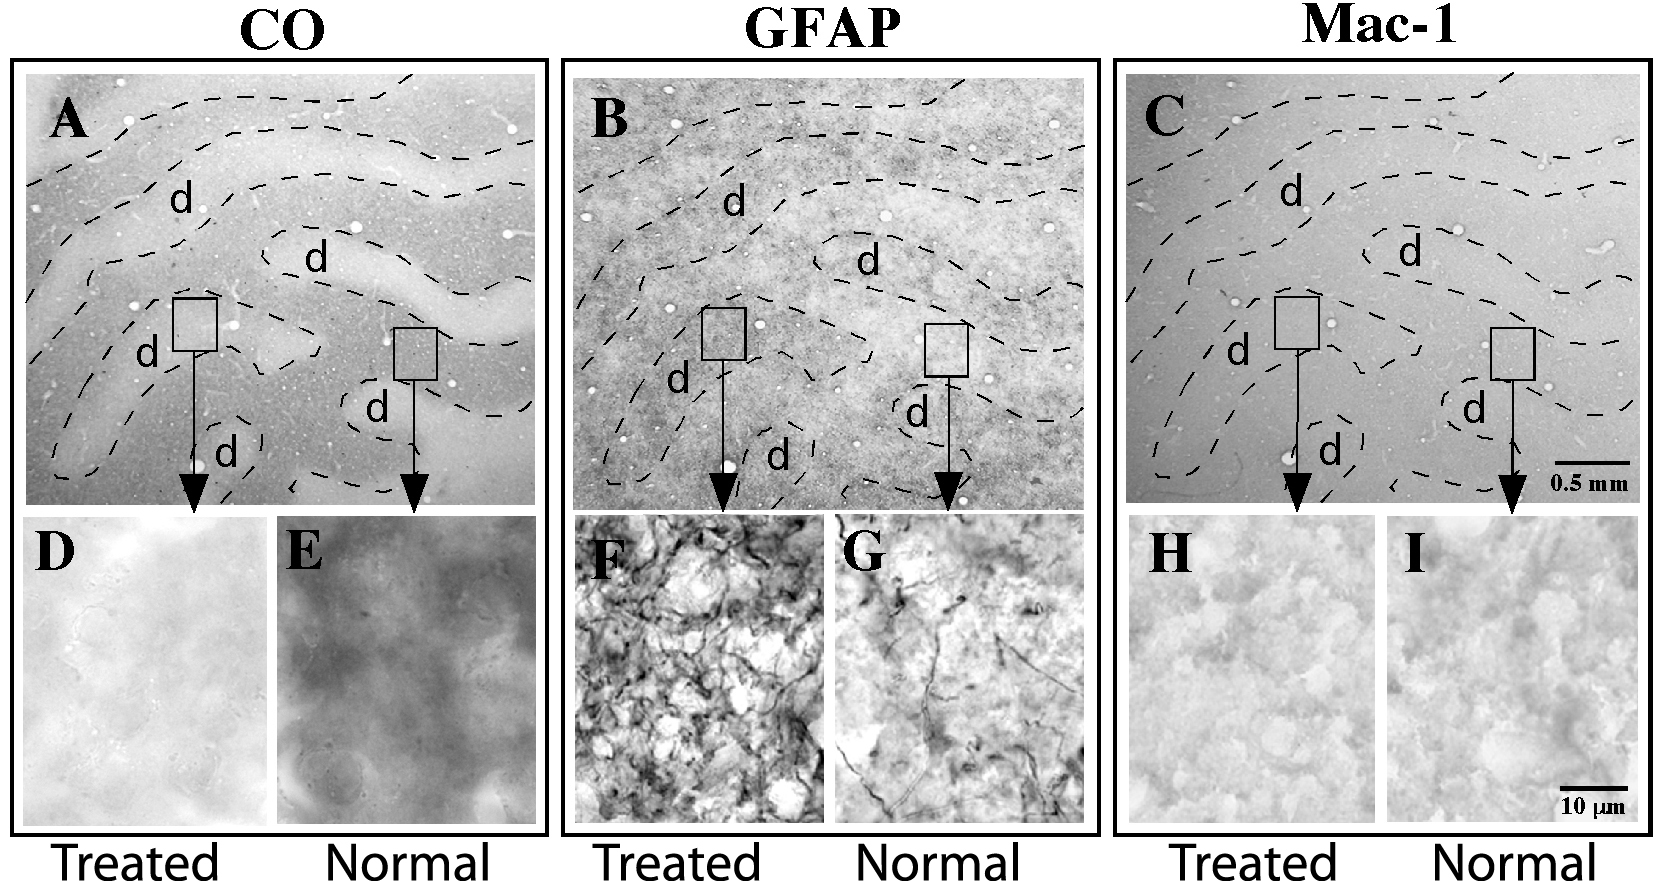
 Figure 4 of Lam, Mol Vis 2009; 15:2217-2229.