Figure 2. Photomicrographs of serial
tangential sections through layer 4C of V1 from an ONT brain. A:
Section stained for CO histochemistry demonstrates ocular dominance
bands in tangential sections through layer 4c of V1. Note the treated
eye bands (d) demonstrate lighter, less dense CO staining. B: A
serial section stained for GFAP immunohistochemistry demonstrates
denser, more robust immunoreactivity in the ocular dominance bands
associated with the treated eye (d). C: A serial section
stained for MAC-1 immunohistochemistry demonstrates more robust
immunoreactivity in the ocular dominance bands associated with the
treated eye (d). Arrows point to high power photographs (100X) are
shown and contrast staining in treated and normal eye bands for CO (D,
E), GFAP (F, G), or MAC-1 (H, I) immunoreactivity.
Note astrocytic profiles and processes in F and microglial
profiles in H.
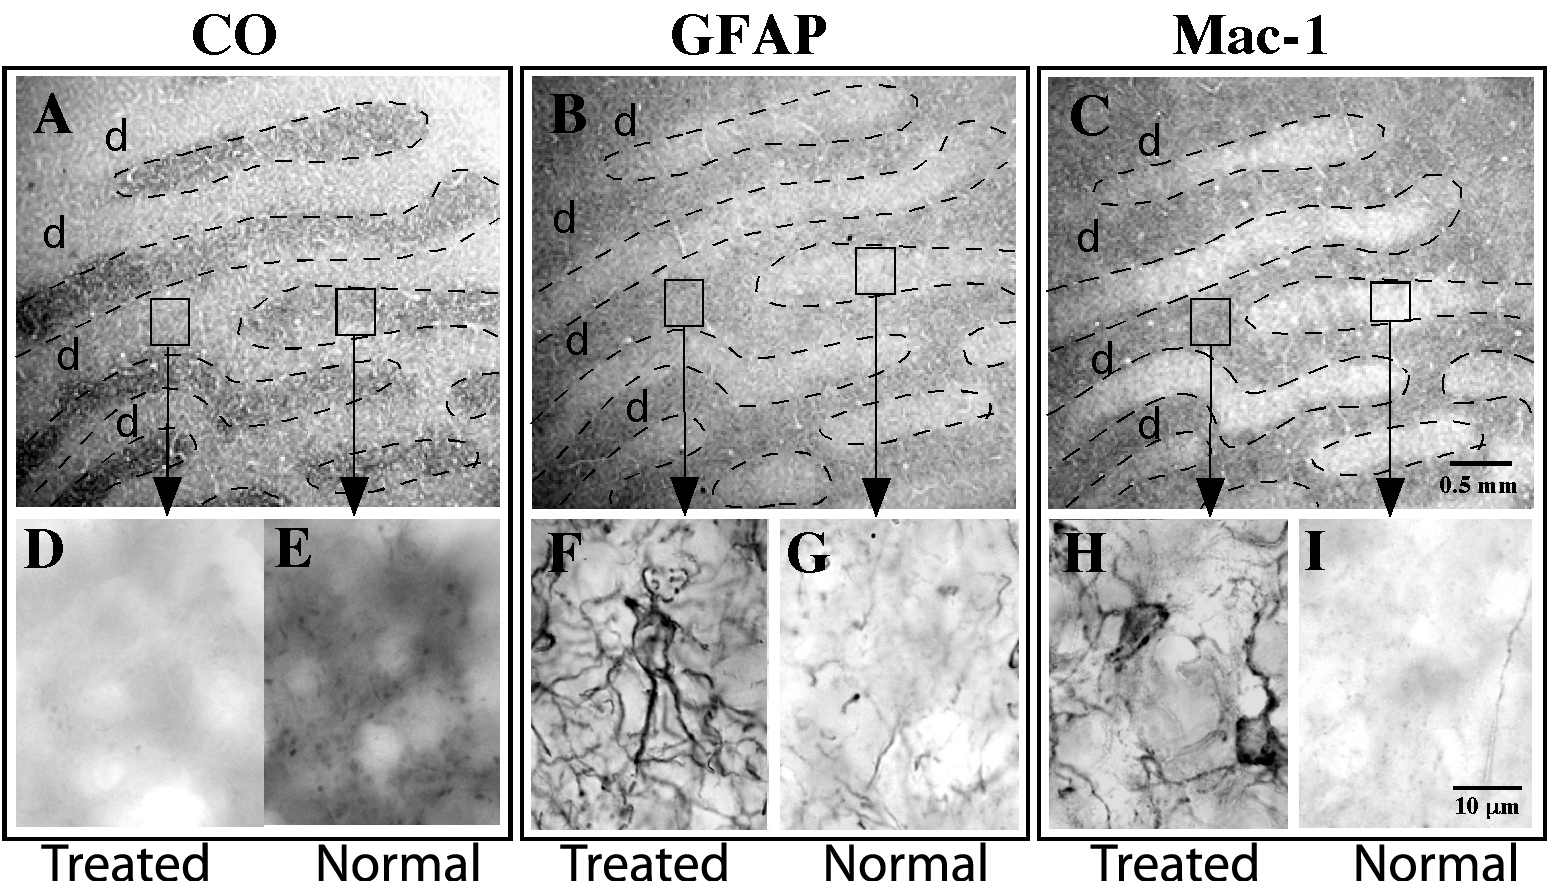
 Figure 2 of Lam, Mol Vis 2009; 15:2217-2229.