Figure 3. Circadian rhythms in the
wild-type and Gnat1−/− cone ERG. Wild-type mice
showed significant difference in b-wave amplitude (A) and
implicit time (B) over the course of light adaptation when
measured at CT6 (open circles) compared to CT18 (closed circles) F test
curve fit comparison p<0.0001 for each parameter. Similar effects of
circadian phase were observed on b-wave amplitude (C; F test
p<0.0001) and implicit time (D; F test p<0.0001) in Gnat1−/−
mice. All data are shown as mean±SEM. Replicates for A and B
were: n=10 (CT6), n=8 (CT18), for C and D: n=8 (CT6),
n=6 (CT18). The estimated parameters for curve fit for the curves in A
were, CT6: Y0=-5.061 a=149, k=0.124, CT18: Y0=-2.029
a=127, k=0.1082. Estimated parameters for B, CT6: Y0=83.39,
a=54.94, k=0.143, CT18: Y0=96.08, a=59.07, k=0.176.
Estimated parameters for C, CT6: Y0=88.72, a=194.4,
k=0.127, CT18: Y0=46.62, a=159.3, k=0.0666. Estimated
parameters for D, CT6: Y0=56.23, a=51.78, k=0.283,
CT18: Y0=59.20, a=52.11, k=0.087.
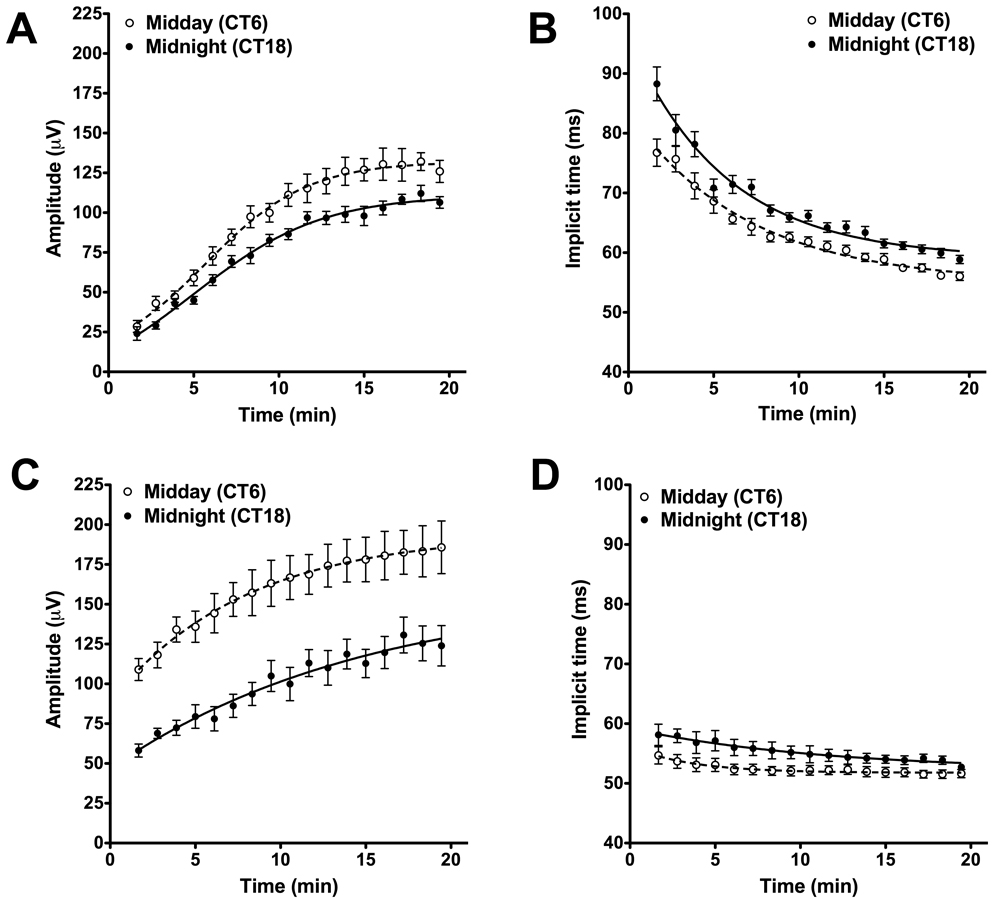
 Figure 3 of Cameron, Mol Vis 2009; 15:2209-2216.