Figure 2. Comparison of cone ERG traces
from Gnat1−/− and wild-type mice over the course of
light adaptation. A shows representative ERG traces from Gnat1−/−
(gray trace) and wild-type (black trace) mice recorded at CT6 in
response to a bright white flash superimposed on a rod saturating
background. At the beginning of light adaptation (top), b-waves were
much more noticeable in Gnat1−/− animals than in
wild-types. The magnitude of this difference was reduced as light
adaptation proceeded. The arrow in A depicts flash onset, scale
bar=50 ms (x-axis), 50 μV (y-axis) and numbers to left correspond to
the time exposed to the rod saturating background in minutes. B
shows quantification of b-wave amplitude against time spent exposed to
the adapting light in Gnat1−/− (closed squares)
compared to wild-type (open squares). Gnat1−/− mice
show significantly larger responses than wild-types (F test curve fit
comparison p<0.0001). C shows that b-wave implicit time (IT)
was much reduced in Gnat1−/− mice compared to
wild-types across all time points (F test curve fit comparison
p<0.0001). Data in B and C is shown as mean±SEM.
Replicates for B and C are: n=10 for wild-types, n=8
for Gnat1−/−. All data mean±SEM; n=9 for wild-types,
n=8 for Gnat1−/−. The estimated parameters for curve
fit for the curves in B (wild-type) are, amplitude: Y0=-5.061
a=149, k=0.124, implicit time: Y0=83.39, a=54.94, k=0.143.
The curve fit for C (Gnat1−/−) estimated
parameters are, amplitude: Y0=88.72, a=194.4, k=0.127,
implicit time: Y0=56.23, a=51.78, k=0.283.
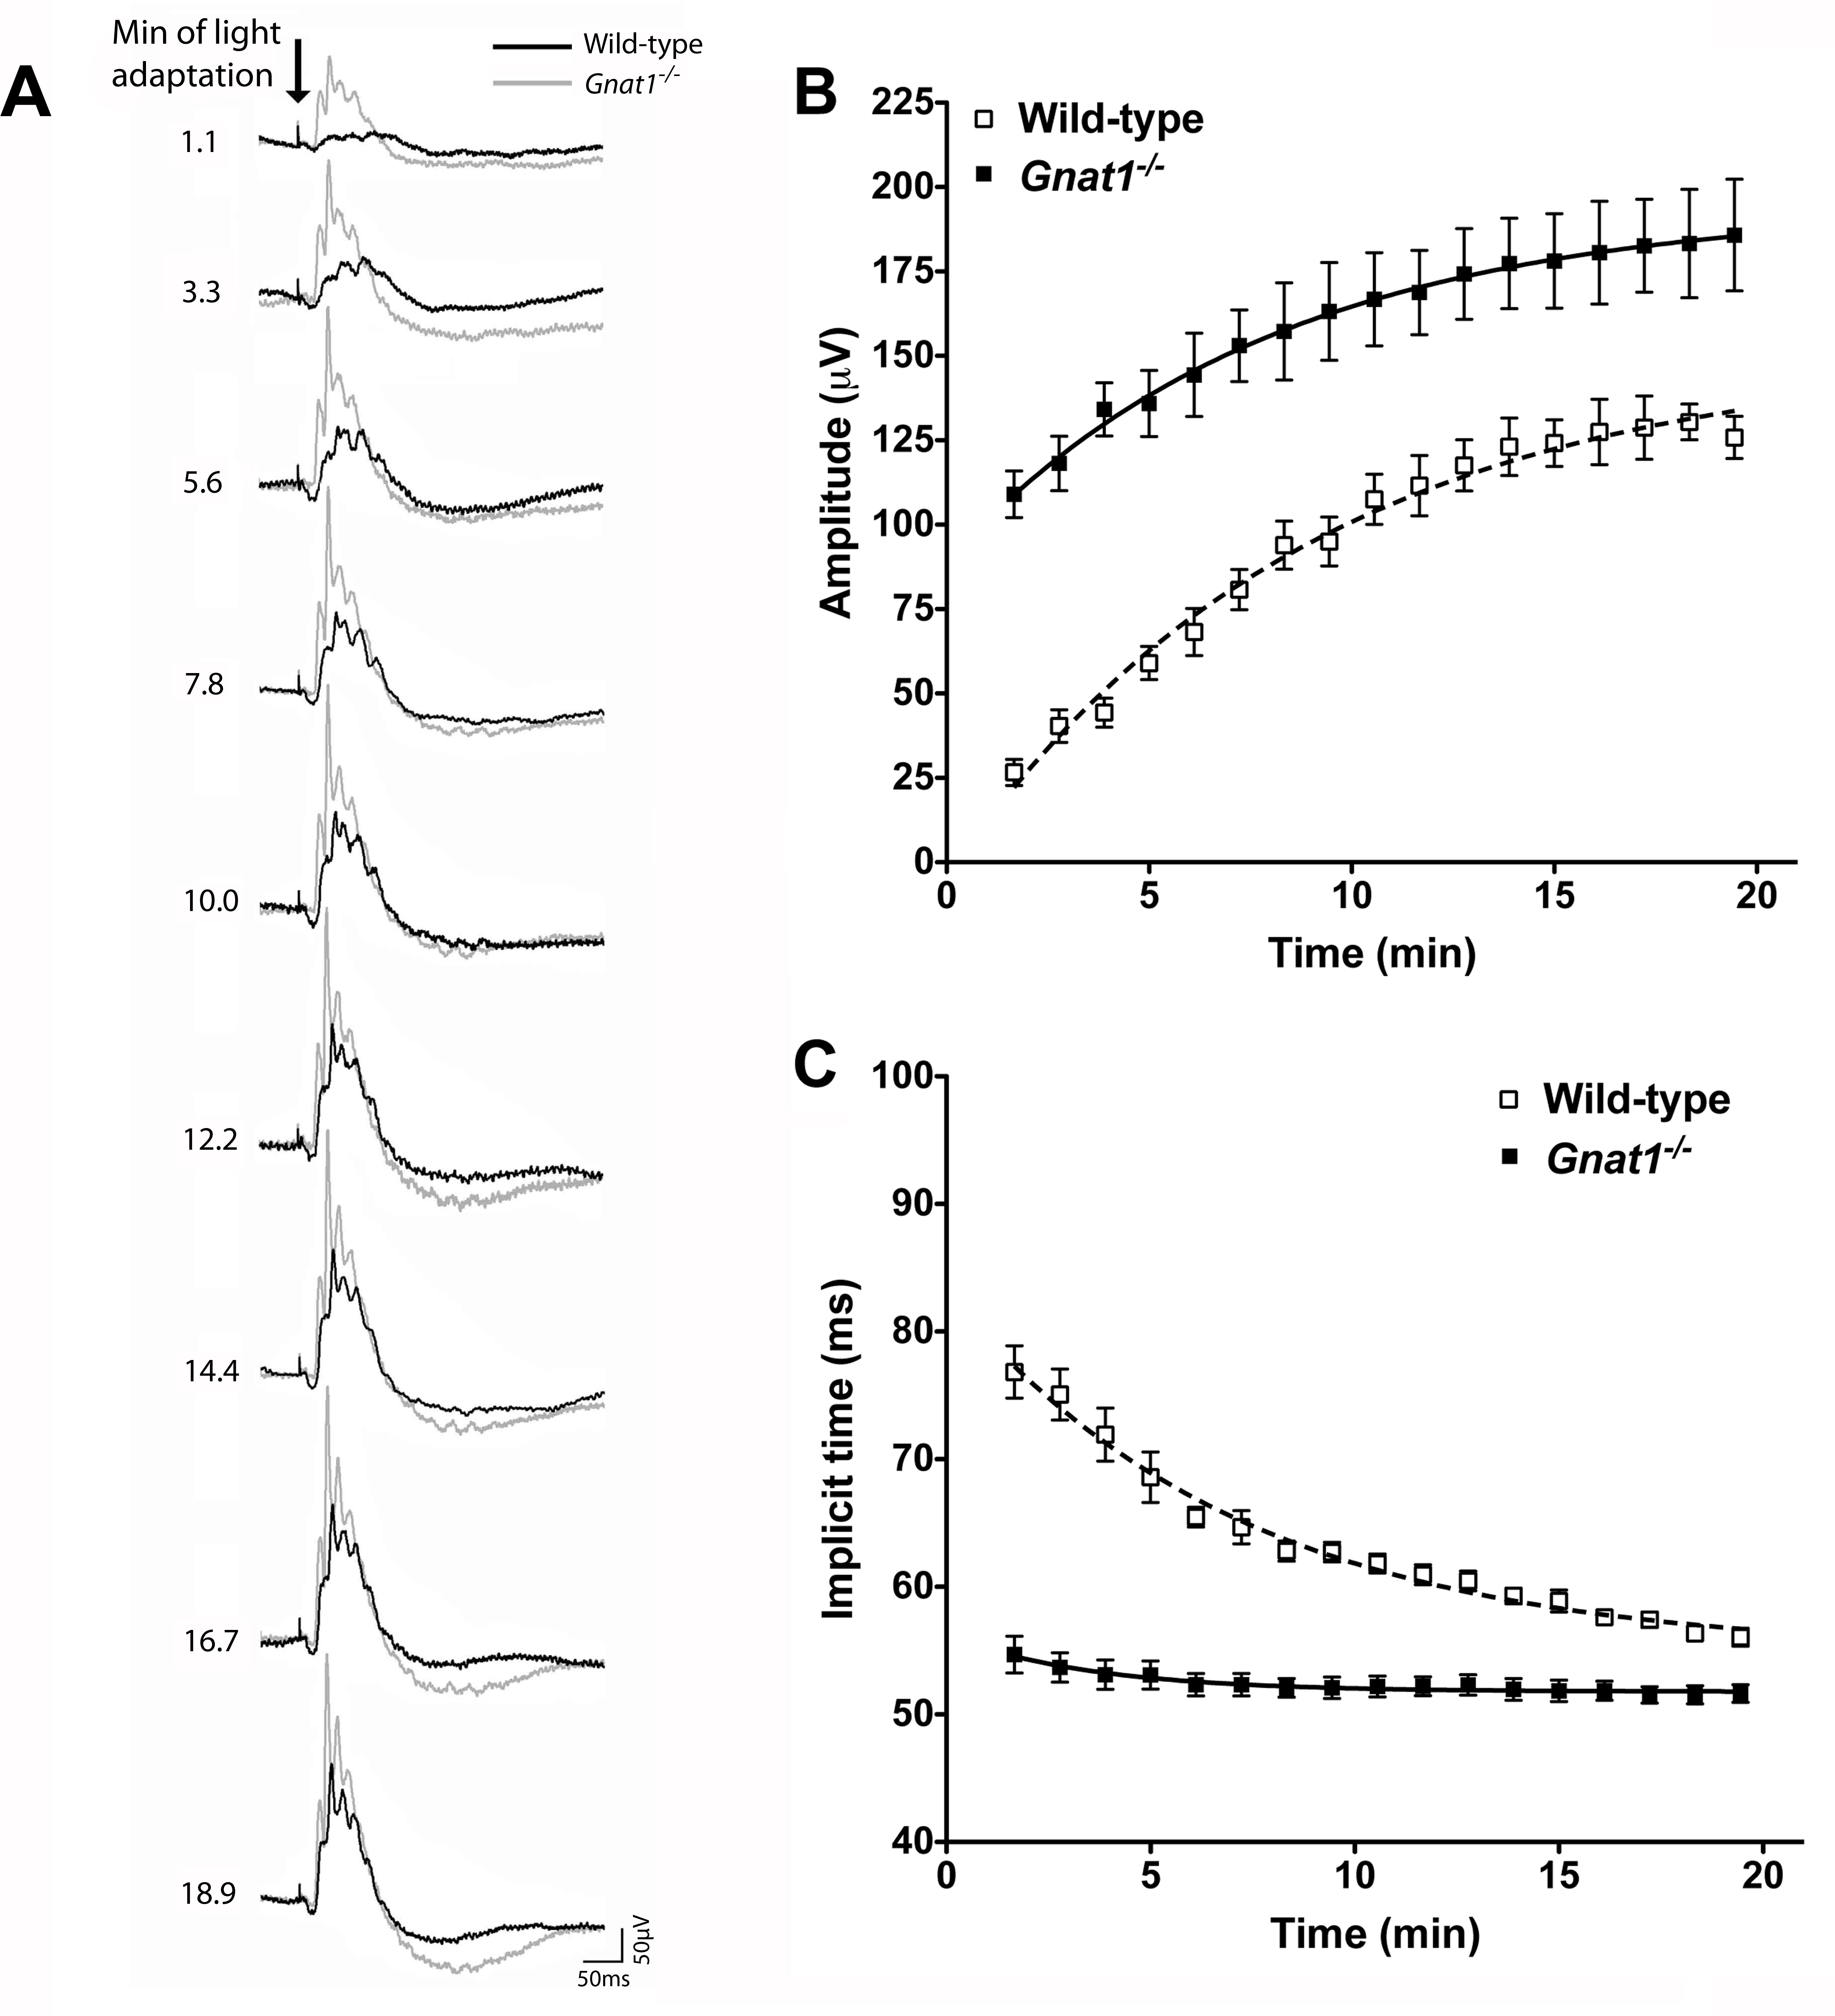
 Figure 2 of Cameron, Mol Vis 2009; 15:2209-2216.