Figure 1. Dark-adapted ERG of Gnat1−/−
mice. A shows representative dark-adapted ERG traces from Gnat1−/−
mice recorded in response to white flashes of increasing irradiance at
subjective midday (CT6) after approximately 18 h dark adaptation. B
and C show quantification of b-wave amplitude and implicit time
of ERGs from Gnat1−/− (black) and wild-type (gray)
mice. Implicit time could only be measured when a reliable b-wave was
discerned and is therefore absent at lower flash intensities. The arrow
in A indicates flash onset and numbers on left indicate
irradiance in log W/m2 (these radiometric irradiances equate
to ~–1.0 to 2.5 log cd-sec/m2). Data in B and C
is shown as mean±SEM. Replicates for B and C are: n=6
for Gnat1−/−; n=8 wild-type.
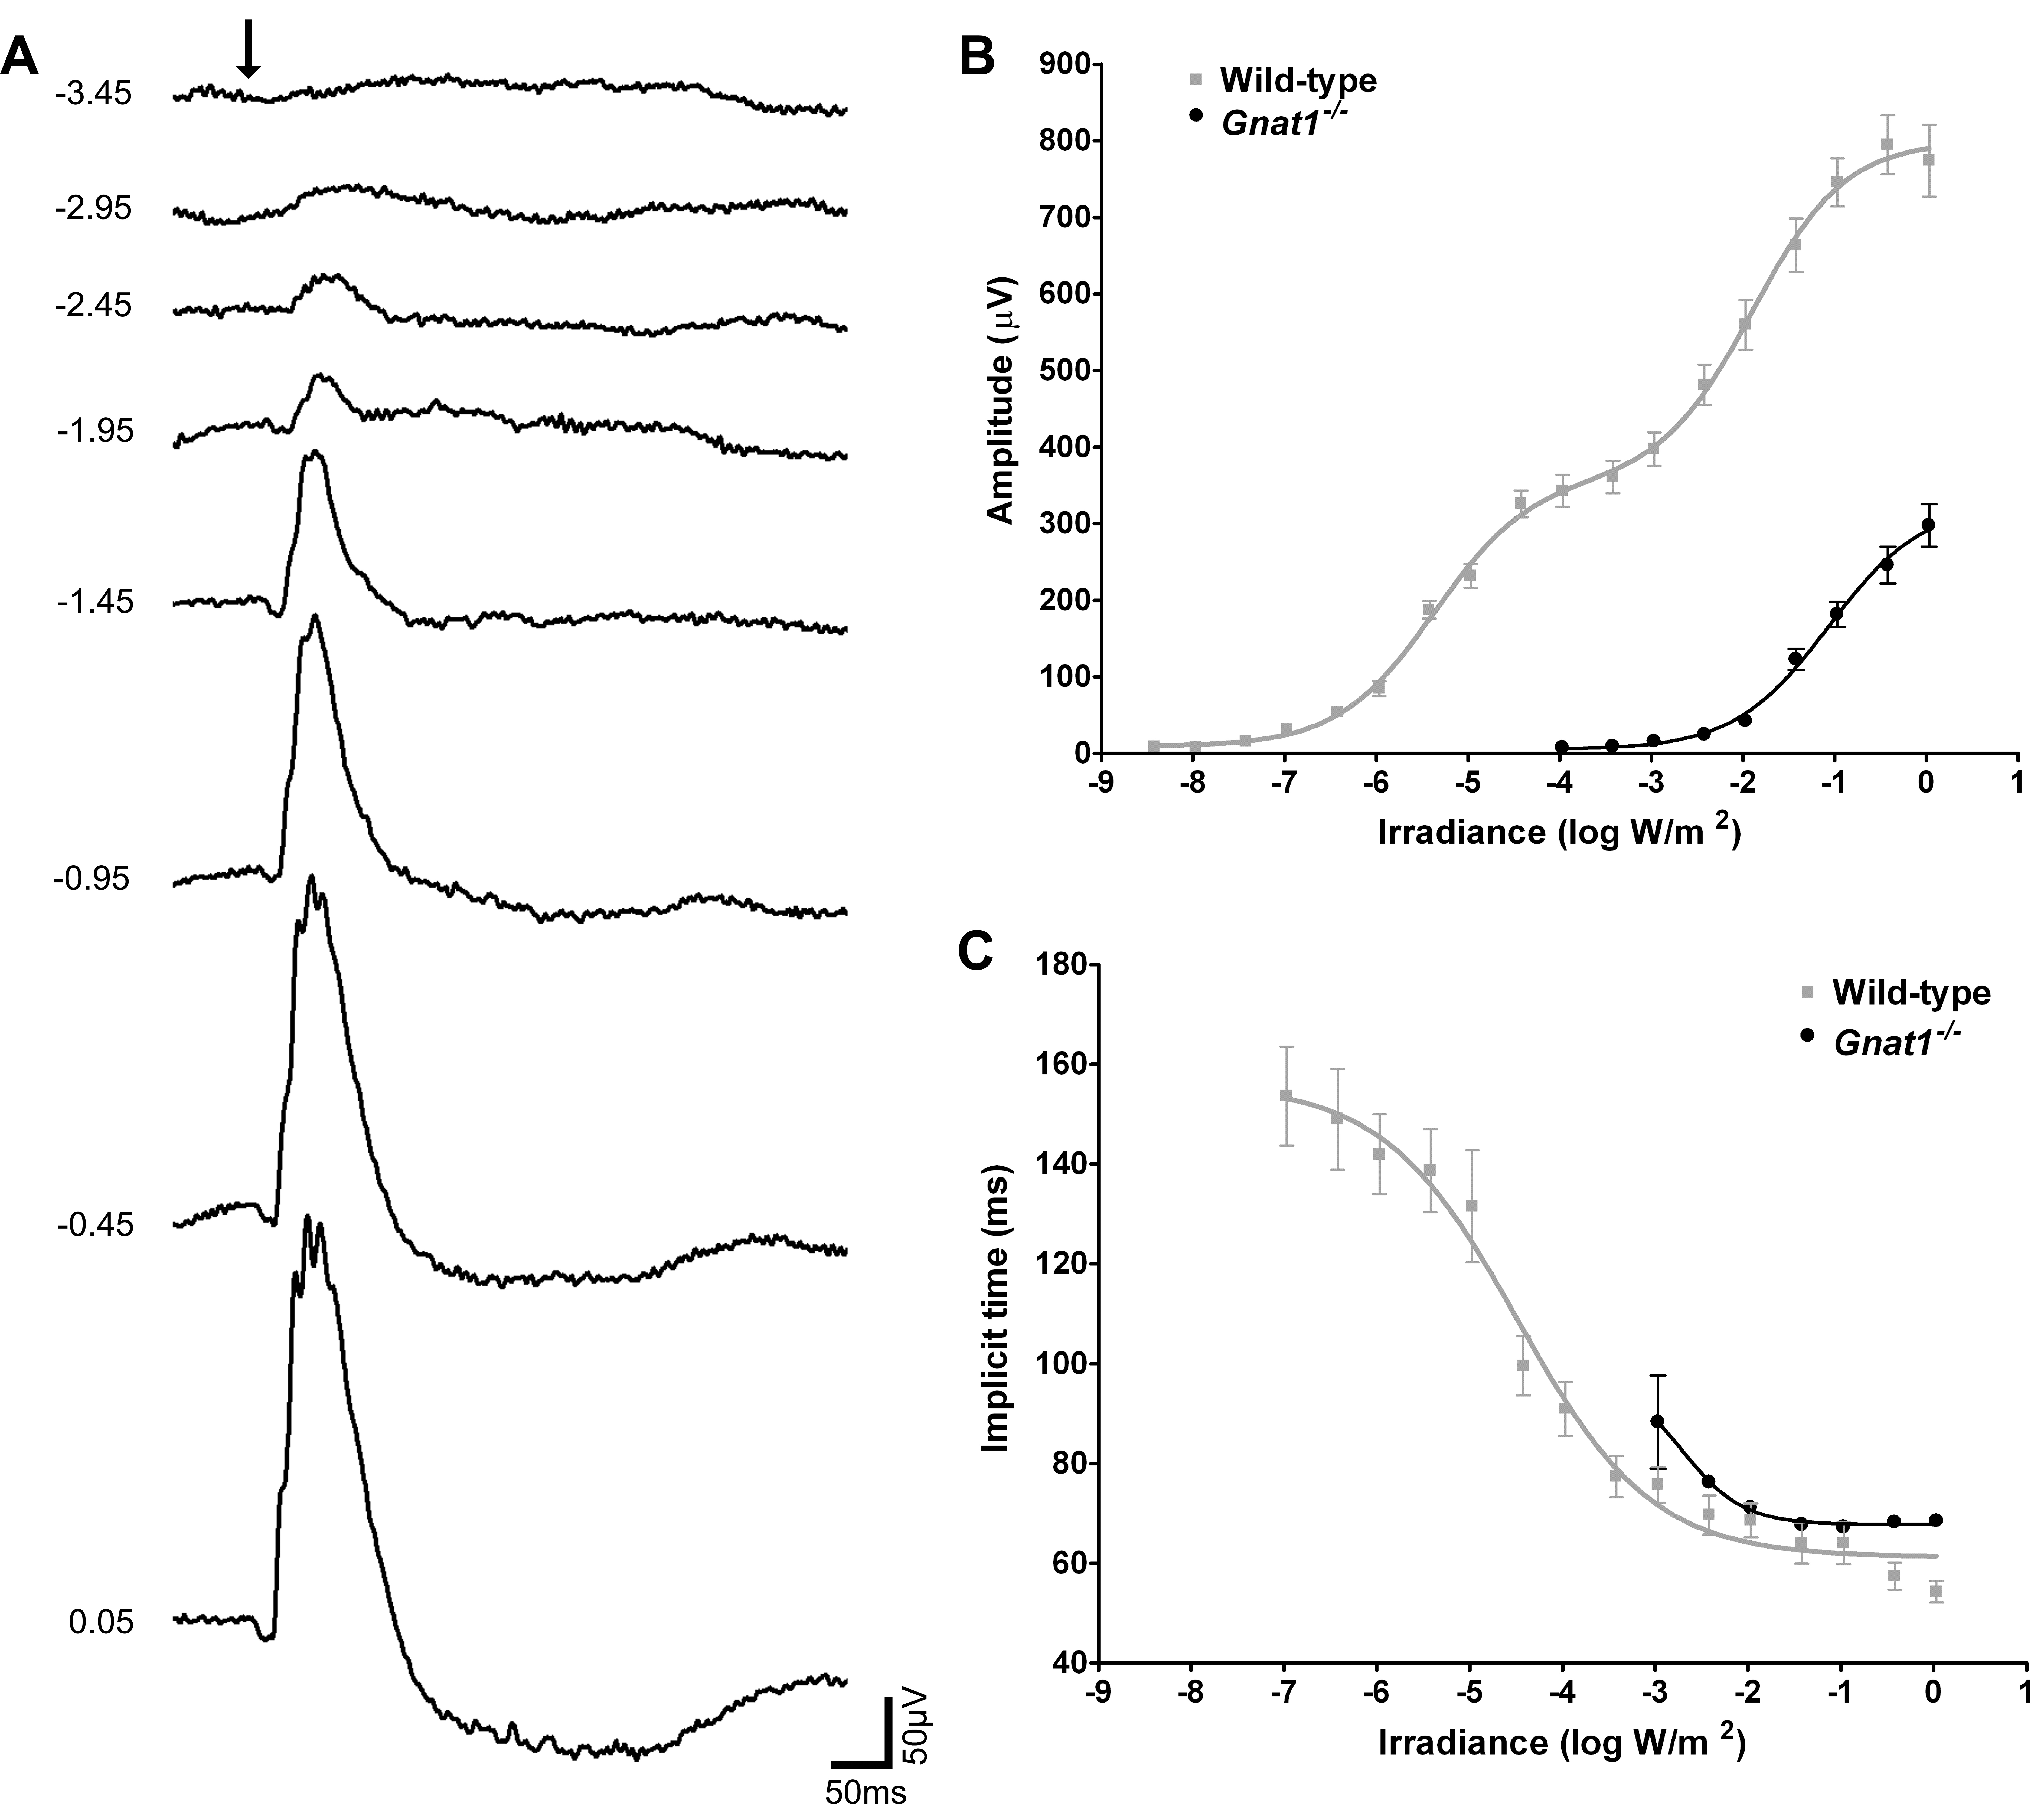
 Figure 1 of Cameron, Mol Vis 2009; 15:2209-2216.