Figure 1. The haplotype block structure and the position of the studied tag single nucleotide polymorphisms of CALCRL. The relative physical position of each tag single nucleotide polymorphism (SNP) is given together with the rs number in
the upper part of the diagram. Pair-wise SNP D’ values (multiply by 100) of linkage are shown together with two identified
haplotype blocks. The bright red rectangles represent D’=100 (multiply by 100).
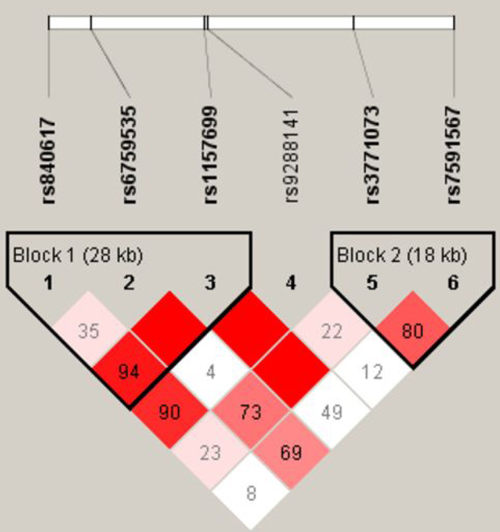
 Figure 1 of
Cao, Mol Vis 2009; 15:2202-2208.
Figure 1 of
Cao, Mol Vis 2009; 15:2202-2208.