Figure 3. Tarsal cell cycle analysis by flow cytometry. A: When morphological cell parameters were analyzed by size and complexity, 70.1% of the cell population was homogeneous when
observed in the flow cytometer gate C, which selects for cell cycle analysis of total cells. B: In flow cytometry gates D, G, and N, 70.3% were 2n cells (G1/G0), 4.2% were cells in S, and 16.5% were 4n cells (G2/M).
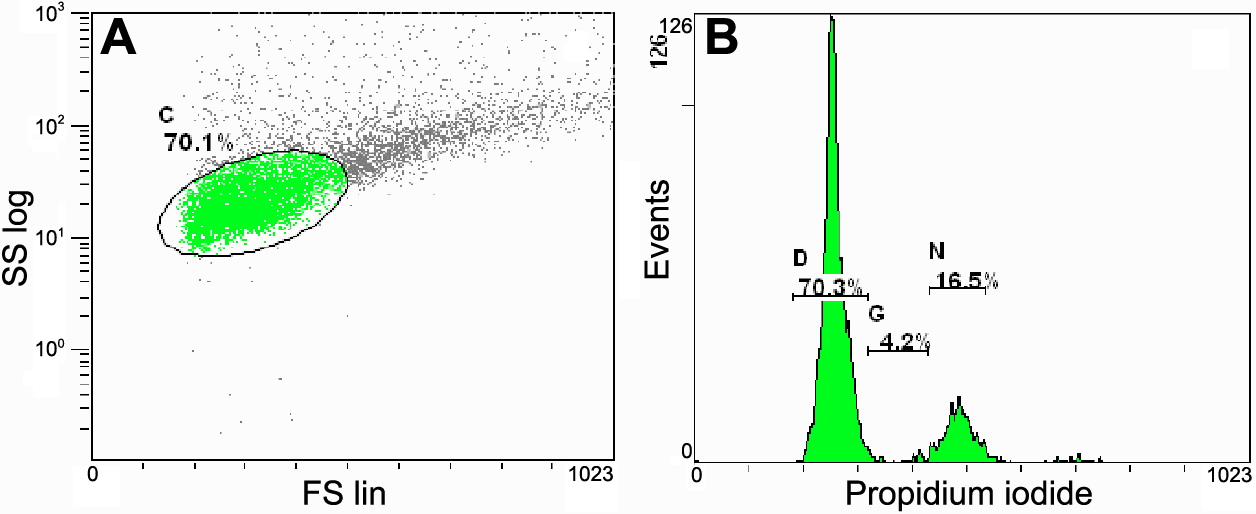
 Figure 3 of
Martínez-Osorio, Mol Vis 2009; 15:2185-2195.
Figure 3 of
Martínez-Osorio, Mol Vis 2009; 15:2185-2195.