Figure 1. Cell lineage analysis determined
by flow cytometry. A: Forward scatter (FS) versus side scatter
(SS) plot showing conjunctival tarsal cells recovered by brush cytology
(BC) in 10% fetal bovine serum (FBS) supplemented medium (FBSm10). B:
CD45 versus SS dot plot showing a leukocyte population (gate A, red),
epithelial cells (gate B, blue) and cellular debris (gray dots). C:
CD45 versus CK7 dot plot showing a CD45+CK7- leukocyte population
(region L4), CK7+CD45- epithelial cells (region L1) and CK7-CD45-
cellular debris (region L3). D: Analysis of CK7 expression
(blue line) over total BC-recovered cells; 67.1% of the cells were
positive (isotype-matched negative control in dotted line).
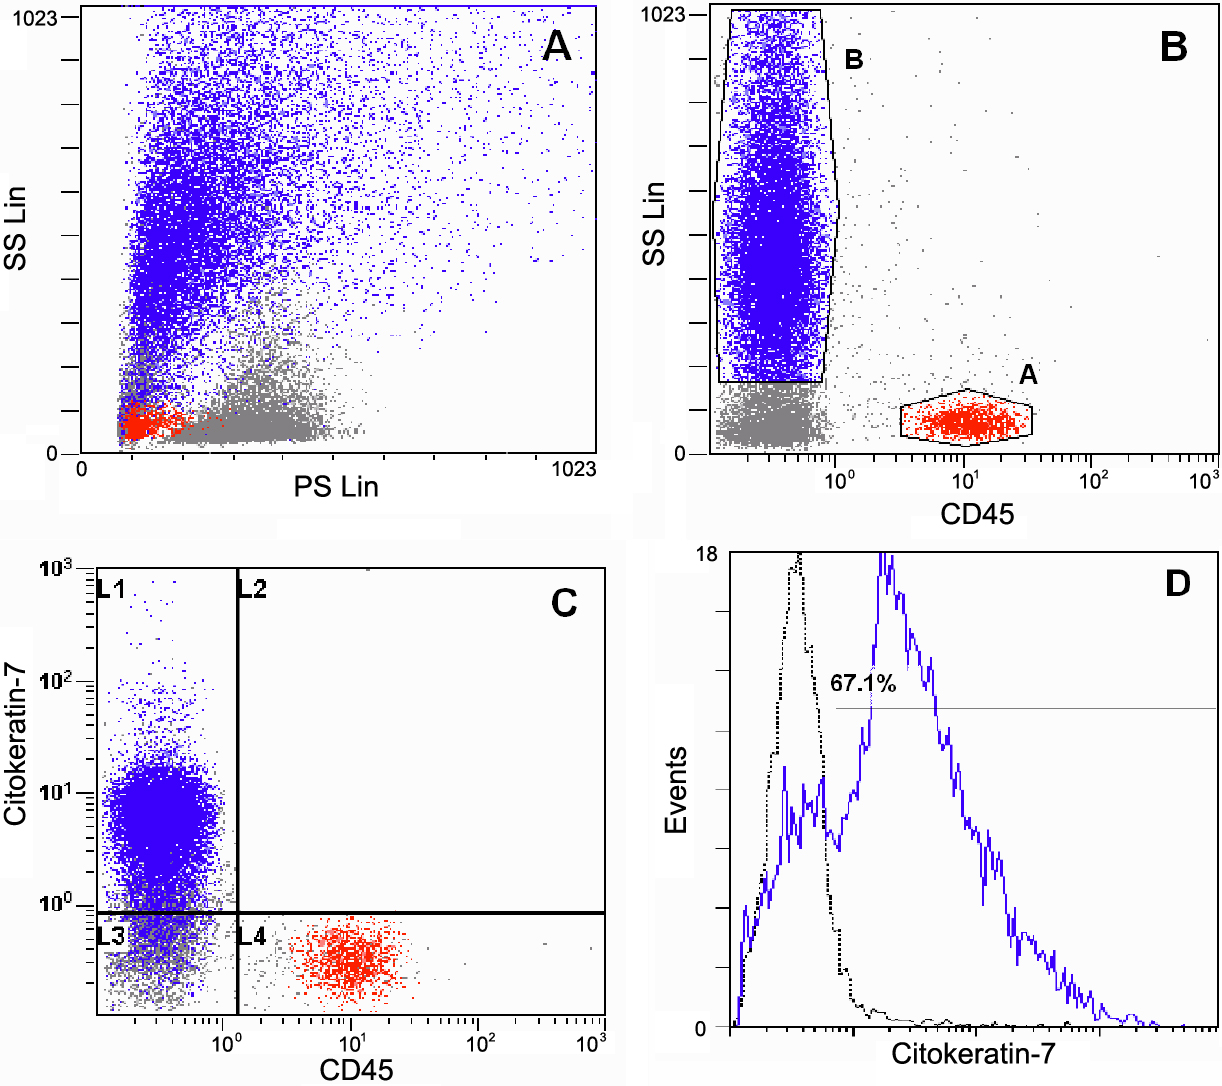
 Figure 1 of Martínez-Osorio, Mol Vis 2009; 15:2185-2195.