Figure 1. Quantification of KIF14
and E2F3 mRNA expression levels in tumor and control samples
calibrated to fetal control retina (F2). There was statistically
significant overexpression of KIF14 and E2F3 mRNA
expression in tumors compared to fetal retinal, age-matched and adult
control retinas (p<0.0001). There was a significant overexpression
of E2F3 expression compared to RB cell line controls (p=0.01).
The chemotherapy-treated subset (last two unshaded bars) showed a
significant decrease in the expression of KIF14 (p<0.01) and
E2F3 (p<0.001) compared to untreated tumors. Error bars
represent standard error of the relative fold expression levels of KIF14
and E2F3.
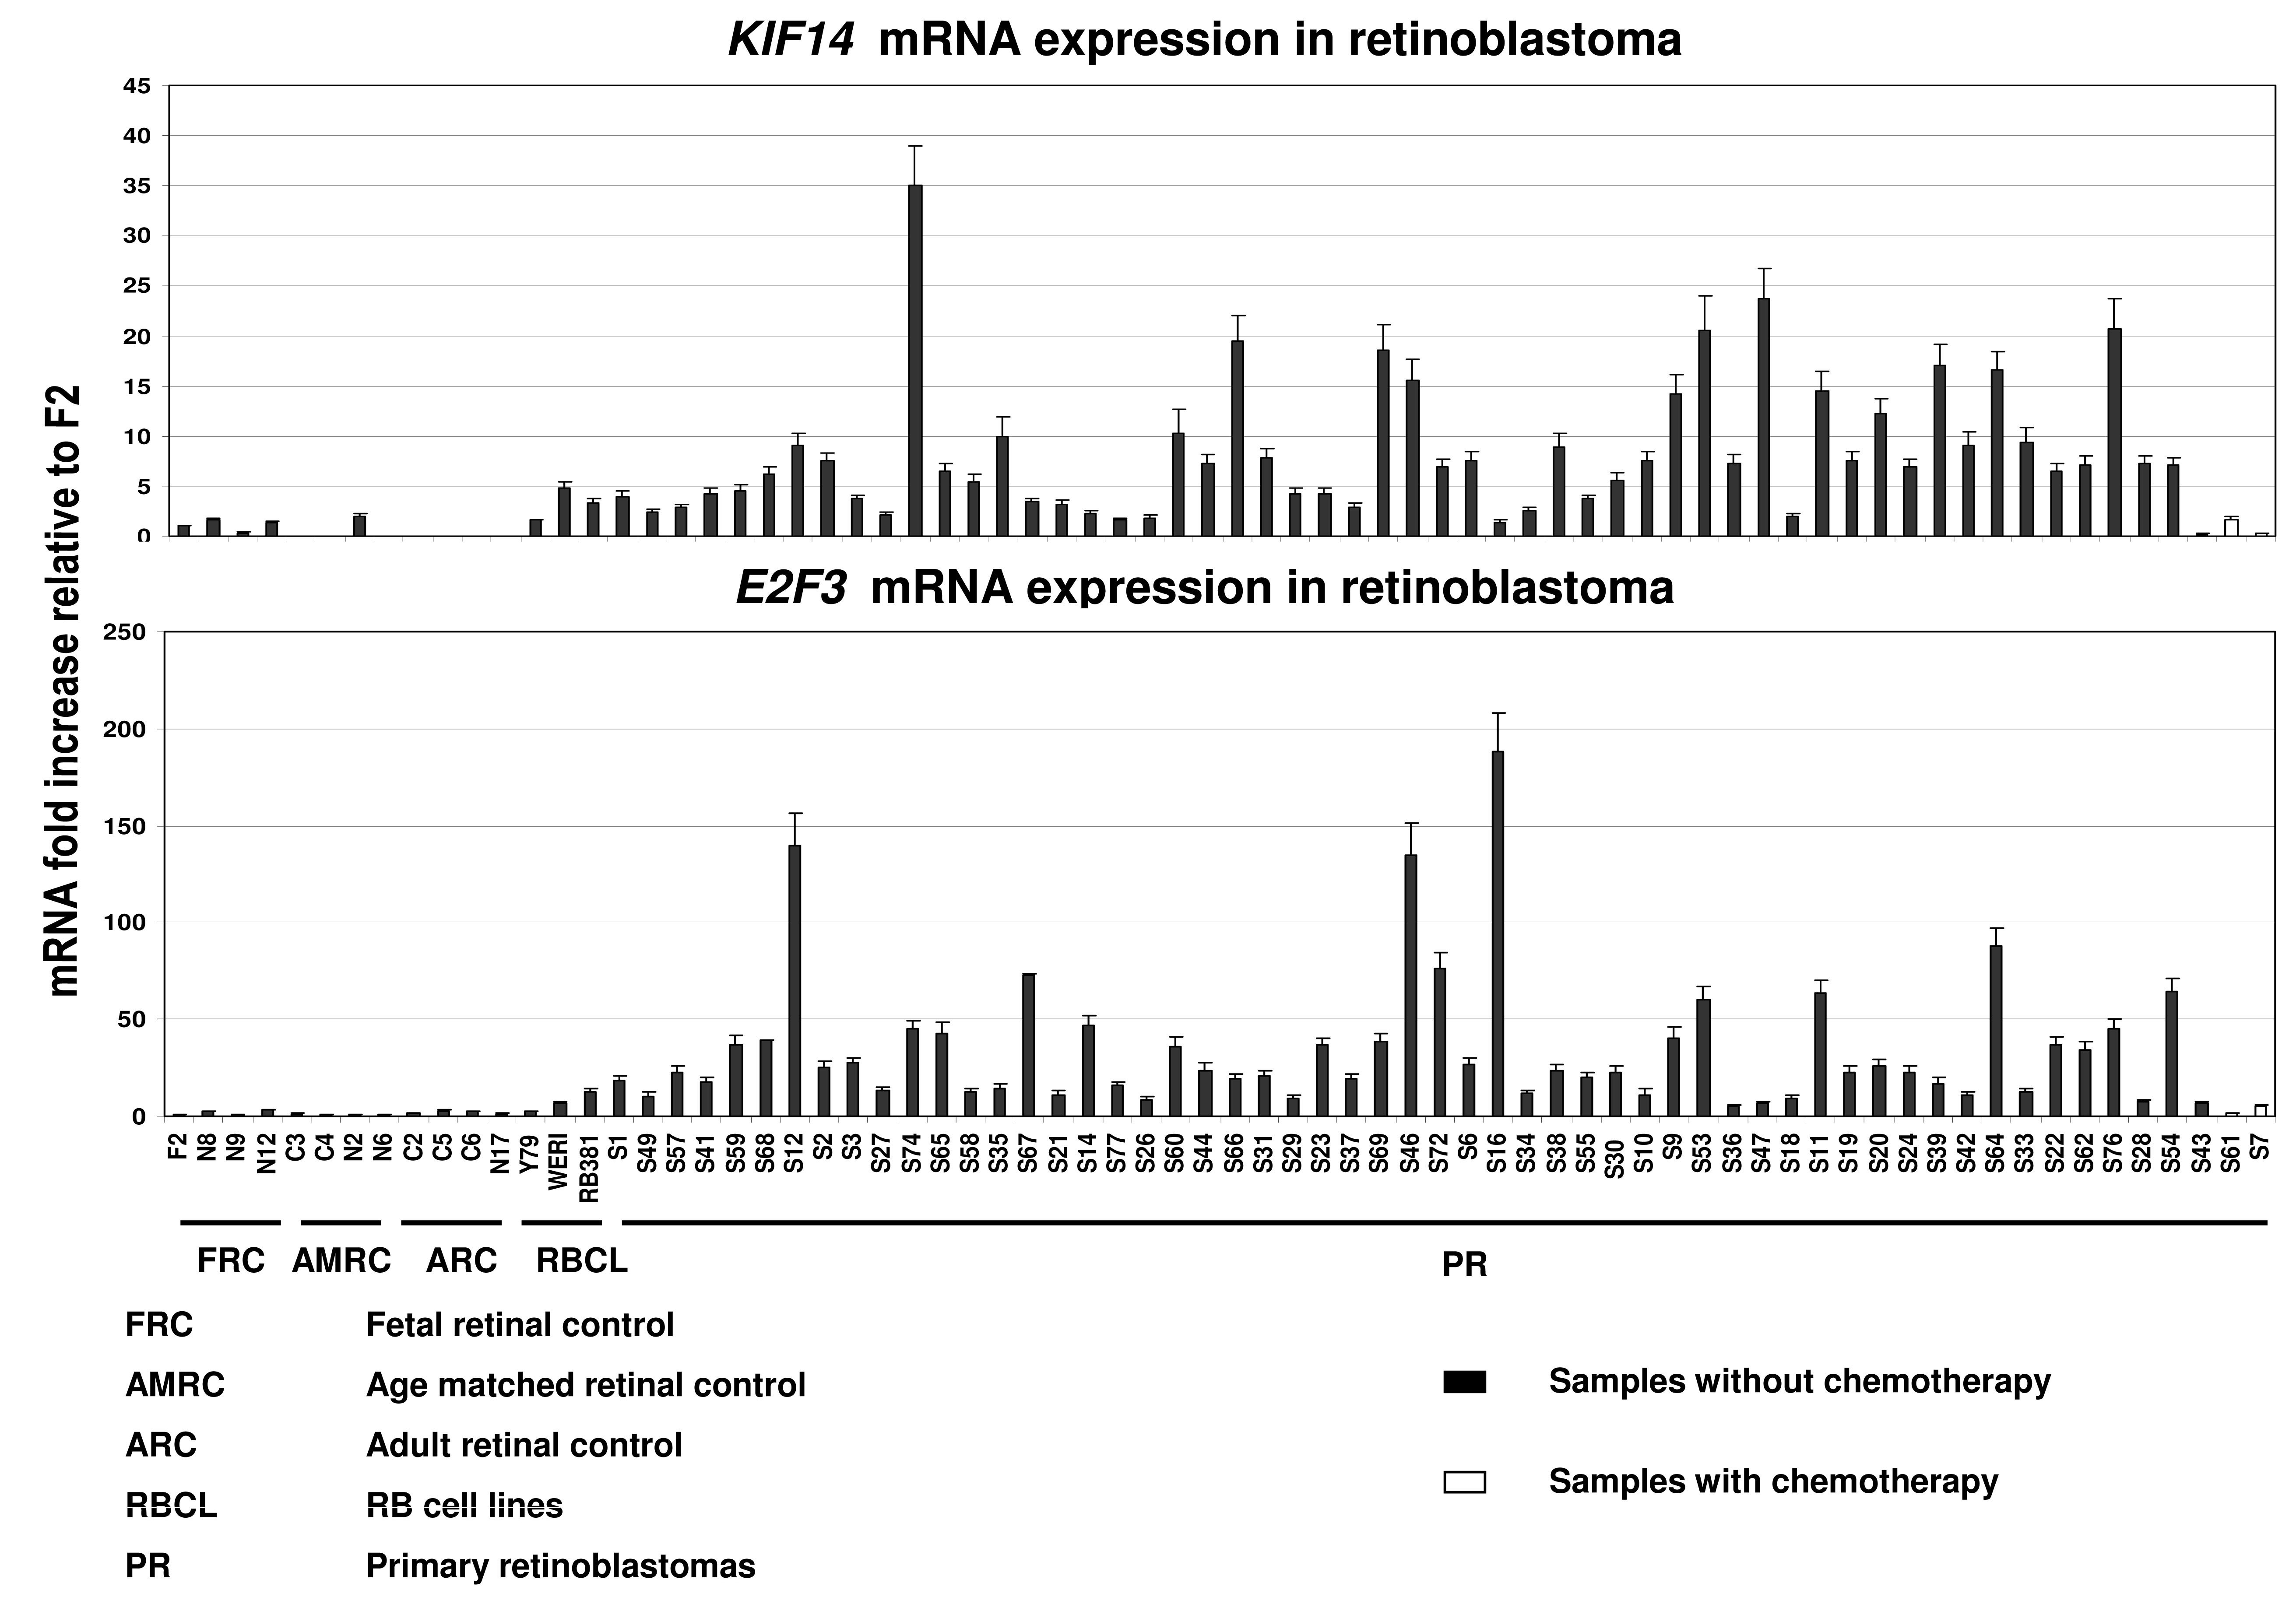
 Figure 1 of Madhavan, Mol Vis 2009; 15:235-240.