Figure 4. Immunofluorescent analysis of the expression of α-smooth muscle actin. A: No treatment control, B: 10 ng/ml transforming growth factor (TGF)-β1 for 72 h, C: IL-6-specific small interfering (si)RNA, D: IL-6-specific siRNA plus 10 ng/ml TGF-β1 for 72 h, E: IL-11-specific siRNA, and F: IL-11-specific siRNA plus 10 ng/ml TGF-β1 for 72 h. The secondary antibody was conjugated with fluoroscein isothiocyanate, resulting
in green fluorescence. Total magnification was 400×.
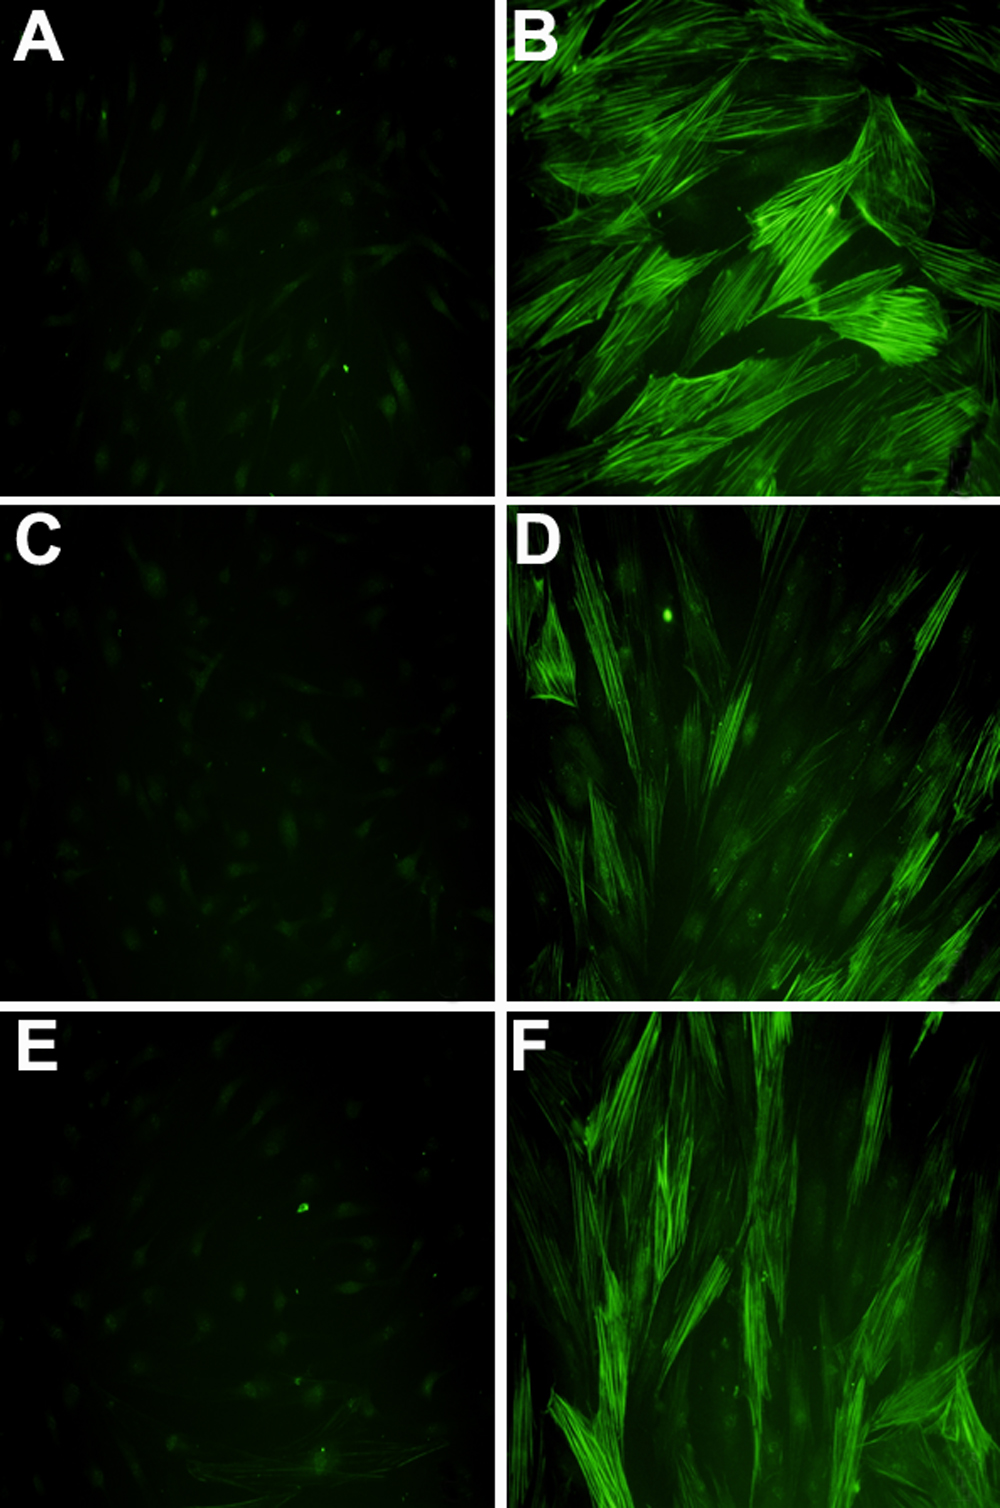
 Figure 4 of
Seong, Mol Vis 2009; 15:2123-2128.
Figure 4 of
Seong, Mol Vis 2009; 15:2123-2128.